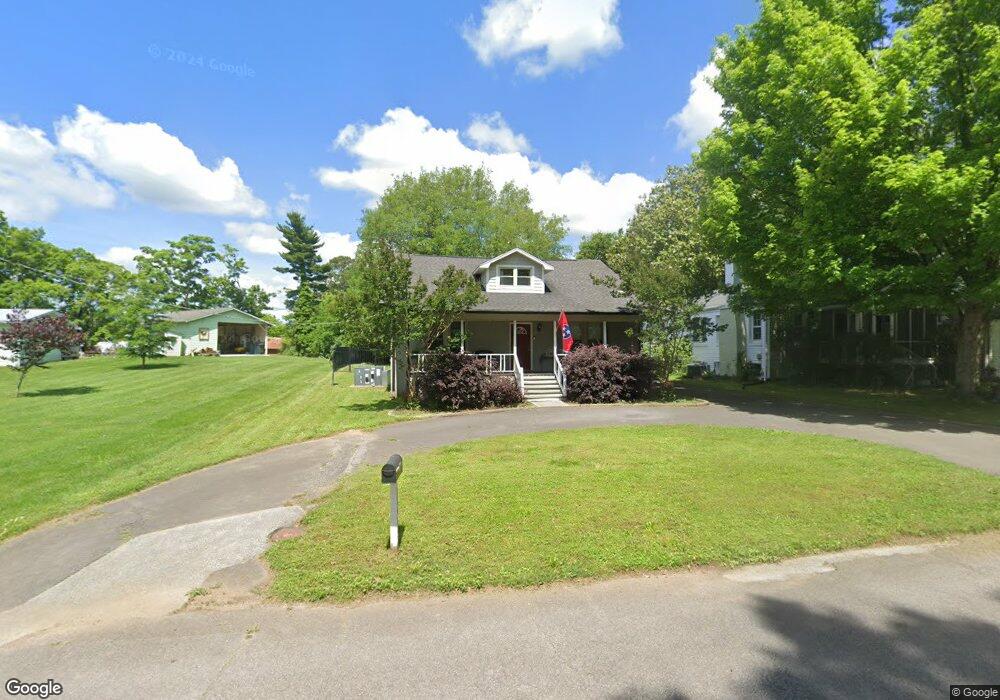
1843 Oak St NW Cleveland, TN 37311
Estimated Value: $301,876 - $428,000
4
Beds
2
Baths
2,170
Sq Ft
$164/Sq Ft
Est. Value
About This Home
This home is located at 1843 Oak St NW, Cleveland, TN 37311 and is currently estimated at $355,719, approximately $163 per square foot. 1843 Oak St NW is a home located in Bradley County with nearby schools including United Christian Academy and Lee University’s Development Inclusion Classroom.
Ownership History
Date
Name
Owned For
Owner Type
Purchase Details
Closed on
Jun 9, 2014
Sold by
Whitmer Katelyn
Bought by
Tilley Jared D and Tilley Victoria H
Current Estimated Value
Home Financials for this Owner
Home Financials are based on the most recent Mortgage that was taken out on this home.
Original Mortgage
$166,920
Outstanding Balance
$126,230
Interest Rate
4.28%
Mortgage Type
FHA
Estimated Equity
$229,489
Purchase Details
Closed on
Jun 25, 2009
Sold by
Trevena Bill
Bought by
Whitmer Katelyn
Home Financials for this Owner
Home Financials are based on the most recent Mortgage that was taken out on this home.
Original Mortgage
$149,737
Interest Rate
4.88%
Mortgage Type
Purchase Money Mortgage
Purchase Details
Closed on
Oct 19, 2005
Sold by
Borden Andrea L Etvir
Bought by
Trevena Bill
Purchase Details
Closed on
Oct 18, 2005
Sold by
Borden Andrea L Etvir
Bought by
Trevena Bill
Create a Home Valuation Report for This Property
The Home Valuation Report is an in-depth analysis detailing your home's value as well as a comparison with similar homes in the area
Home Values in the Area
Average Home Value in this Area
Purchase History
| Date | Buyer | Sale Price | Title Company |
|---|---|---|---|
| Tilley Jared D | $170,000 | -- | |
| Whitmer Katelyn | $152,500 | -- | |
| Trevena Bill | $125,000 | -- | |
| Trevena Bill | $125,000 | -- |
Source: Public Records
Mortgage History
| Date | Status | Borrower | Loan Amount |
|---|---|---|---|
| Open | Tilley Jared D | $166,920 | |
| Previous Owner | Trevena Bill | $149,737 |
Source: Public Records
Tax History Compared to Growth
Tax History
| Year | Tax Paid | Tax Assessment Tax Assessment Total Assessment is a certain percentage of the fair market value that is determined by local assessors to be the total taxable value of land and additions on the property. | Land | Improvement |
|---|---|---|---|---|
| 2025 | $600 | $64,125 | $9,025 | $55,100 |
| 2024 | $600 | $41,675 | $6,475 | $35,200 |
| 2023 | $1,314 | $41,675 | $6,475 | $35,200 |
| 2022 | $1,314 | $41,675 | $6,475 | $35,200 |
| 2021 | $1,314 | $41,675 | $0 | $0 |
| 2020 | $1,153 | $41,675 | $0 | $0 |
| 2019 | $1,153 | $30,000 | $0 | $0 |
| 2018 | $1,236 | $0 | $0 | $0 |
| 2017 | $684 | $0 | $0 | $0 |
| 2016 | $1,238 | $0 | $0 | $0 |
| 2015 | $1,238 | $0 | $0 | $0 |
| 2014 | $634 | $0 | $0 | $0 |
Source: Public Records
Map
Nearby Homes
- 1923 Oak St NW
- 243 18th St NW
- 2033 Jordan Ave NW
- 1795 Highland Ave NW
- 250 15th St NW
- 320 15th St NW
- 441 15th St NW
- 253 15th St NW
- 2095 Church St NE
- 809 Park Ave NW
- 490 8th St NW
- 538 8th St NW
- 912 Fairmont Ave NW
- 802 22nd St NW
- 1925 Baugh St NE
- 621 Highland Ave NW
- 1002 17th St NW
- 1840 Baugh St NE
- 1830 Baugh St NE
- 1870 Baugh St NE
- 1855 Oak St NW
- 1823 Oak St NW
- 1865 Oak St NW
- 1850 Harle Ave NW
- 1840 Harle Ave NW
- 1856 Oak St NW
- 1875 Oak St NW
- 1860 Harle Ave NW
- 1850 Oak St NW
- 1840 Oak St NW
- 1870 Harle Ave NW
- 480 18th St NW
- 1820 Oak St NW
- 1870 Oak St NW Unit 5/6
- 1880 Harle Ave NW
- 1880 Oak St NW
- 421 18th St NW
- 1920 Harle Ave NW
- 431 18th St NW
- 363 18th St NW