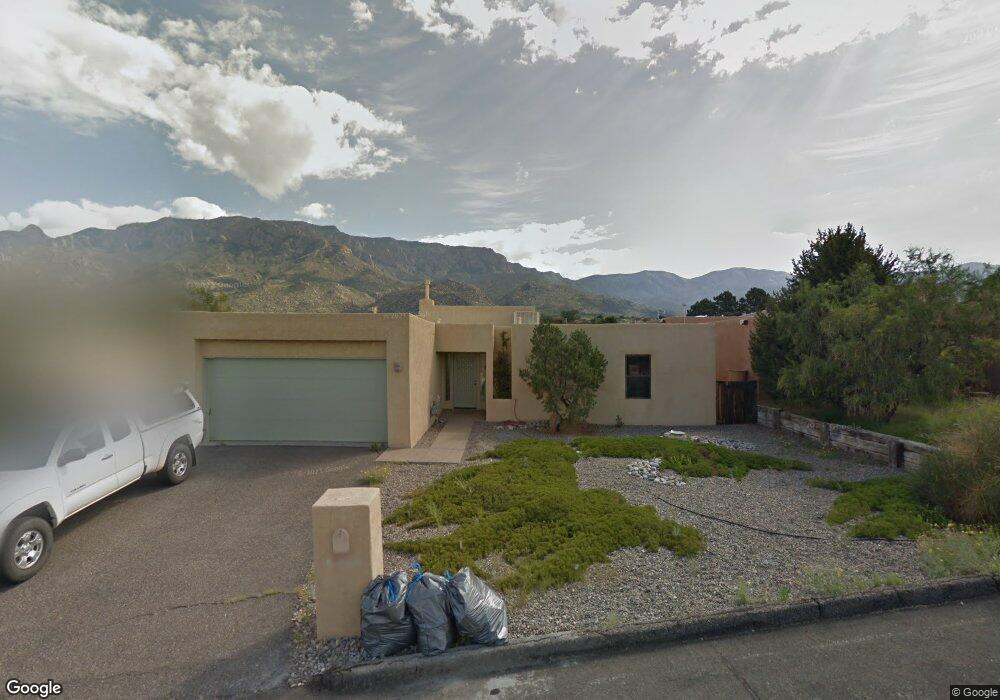
1843 Tramway Terrace Loop NE Albuquerque, NM 87122
Sandia Heights NeighborhoodEstimated Value: $493,000 - $662,663
3
Beds
2
Baths
2,040
Sq Ft
$281/Sq Ft
Est. Value
About This Home
This home is located at 1843 Tramway Terrace Loop NE, Albuquerque, NM 87122 and is currently estimated at $574,166, approximately $281 per square foot. 1843 Tramway Terrace Loop NE is a home located in Bernalillo County with nearby schools including Double Eagle Elementary School, Desert Ridge Middle School, and La Cueva High School.
Ownership History
Date
Name
Owned For
Owner Type
Purchase Details
Closed on
Oct 10, 2009
Sold by
Willett Dallas and Willett Kira
Bought by
Byrne Karen E
Current Estimated Value
Purchase Details
Closed on
Apr 14, 2004
Sold by
Prudential Relocation Inc
Bought by
Willett Dallas and Willett Kira
Purchase Details
Closed on
Apr 9, 2004
Sold by
Burgchardt Kathryn D
Bought by
Prudential Relocation Inc
Purchase Details
Closed on
Oct 3, 2000
Sold by
Cooper Kenneth M
Bought by
Burgchardt Kathryn D
Home Financials for this Owner
Home Financials are based on the most recent Mortgage that was taken out on this home.
Original Mortgage
$203,000
Interest Rate
7.99%
Mortgage Type
VA
Create a Home Valuation Report for This Property
The Home Valuation Report is an in-depth analysis detailing your home's value as well as a comparison with similar homes in the area
Home Values in the Area
Average Home Value in this Area
Purchase History
| Date | Buyer | Sale Price | Title Company |
|---|---|---|---|
| Byrne Karen E | -- | Fidelity Natl Title Ins Co | |
| Willett Dallas | -- | First American | |
| Prudential Relocation Inc | -- | First American | |
| Burgchardt Kathryn D | -- | Fidelity National Title Ins |
Source: Public Records
Mortgage History
| Date | Status | Borrower | Loan Amount |
|---|---|---|---|
| Previous Owner | Burgchardt Kathryn D | $203,000 |
Source: Public Records
Tax History
| Year | Tax Paid | Tax Assessment Tax Assessment Total Assessment is a certain percentage of the fair market value that is determined by local assessors to be the total taxable value of land and additions on the property. | Land | Improvement |
|---|---|---|---|---|
| 2025 | $3,082 | $100,959 | $24,797 | $76,162 |
| 2024 | $2,981 | $98,019 | $24,075 | $73,944 |
| 2023 | $2,932 | $95,165 | $23,374 | $71,791 |
| 2022 | $2,832 | $92,394 | $22,694 | $69,700 |
| 2021 | $2,735 | $89,703 | $22,033 | $67,670 |
| 2020 | $2,689 | $87,090 | $21,391 | $65,699 |
| 2019 | $2,608 | $84,554 | $20,768 | $63,786 |
| 2018 | $2,512 | $84,554 | $20,768 | $63,786 |
| 2017 | $2,433 | $82,092 | $20,164 | $61,928 |
| 2016 | $2,354 | $77,379 | $19,006 | $58,373 |
| 2015 | $75,126 | $75,126 | $18,453 | $56,673 |
| 2014 | $2,199 | $72,939 | $17,916 | $55,023 |
| 2013 | -- | $70,814 | $17,394 | $53,420 |
Source: Public Records
Map
Nearby Homes
- 1861 Tramway Terrace Loop NE
- 906 Tramway Ln NE
- 2402 Tramway Terrace Ct NE
- 975 Antelope Ave NE
- 925 Tramway Ln NE
- 1160 Laurel Loop NE
- 419 Live Oak Ct NE
- 412 Live Oak Loop NE
- 12110 Palomas Ave NE
- 2163 Black Willow Dr NE
- 1405 San Rafael Place NE
- 793 Tramway Ln NE Unit M
- 1239 Rockrose Rd NE
- 12100 Coronado Ave NE
- 2738 Tramway Cir NE
- 1446 Honeysuckle Dr NE
- 1562 Eagle Ridge Ct NE
- 6805 Blanket Flower Place NE
- 11920 Dusty Rose Rd NE
- 11800 Anaheim Ave NE
- 1844 Tramway Terrace Loop NE
- 1842 Tramway Terrace Loop NE
- 1862 Tramway Terrace Loop NE
- 1845 Tramway Terrace Loop NE
- 1841 Tramway Terrace Loop NE
- 1863 Tramway Terrace Loop NE
- 1860 Tramway Terrace Loop NE
- 1846 Tramway Terrace Loop NE
- 1840 Tramway Terrace Loop NE
- 1864 Tramway Terrace Loop NE
- 1859 Tramway Terrace Loop NE
- 1847 Tramway Terrace Loop NE
- 1875 San Bernardino Dr NE
- 1858 Tramway Terrace Loop NE
- 1874 San Bernadino Ave
- 1866 Tramway Terrace Loop NE
- 1818 Tramway Terrace Loop NE
- 1838 Tramway Terrace Loop NE
- 1828 Tramway Terrace Loop NE
- 1820 Tramway Terrace Loop NE
Your Personal Tour Guide
Ask me questions while you tour the home.