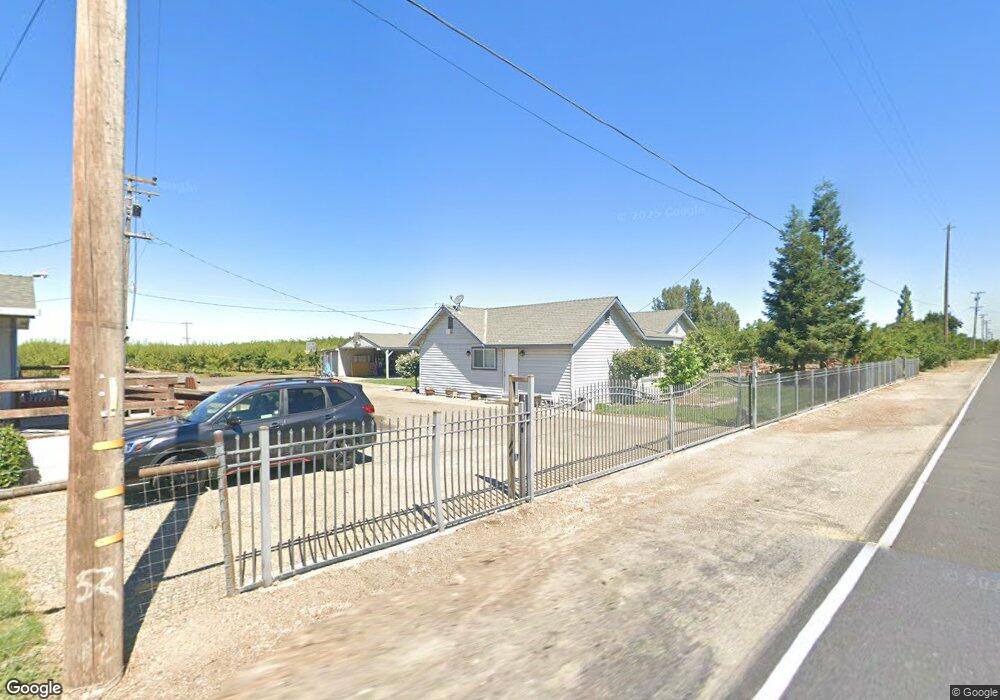
18437 S Van Allen Rd Escalon, CA 95320
Estimated Value: $464,000 - $514,212
4
Beds
4
Baths
2,722
Sq Ft
$180/Sq Ft
Est. Value
About This Home
This home is located at 18437 S Van Allen Rd, Escalon, CA 95320 and is currently estimated at $489,803, approximately $179 per square foot. 18437 S Van Allen Rd is a home located in San Joaquin County with nearby schools including Van Allen Elementary School, El Portal Middle School, and Escalon High School.
Ownership History
Date
Name
Owned For
Owner Type
Purchase Details
Closed on
Mar 17, 2025
Sold by
Thomas E Kaech And Jane M Kaech 2020 Tru and Kaech Thomas E
Bought by
Anderson David G and Anderson Katharine E
Current Estimated Value
Home Financials for this Owner
Home Financials are based on the most recent Mortgage that was taken out on this home.
Original Mortgage
$342,700
Outstanding Balance
$340,953
Interest Rate
6.89%
Mortgage Type
New Conventional
Estimated Equity
$148,850
Purchase Details
Closed on
Jul 27, 2020
Sold by
Kaech Thomas E and Kaech Janie M
Bought by
Kaech Thomas E and Kaech Jane M
Purchase Details
Closed on
Aug 2, 2012
Sold by
Alfieri Gary L
Bought by
Ballatore Bert M and Ballatore Jacqueline
Purchase Details
Closed on
Sep 1, 2003
Sold by
Kaech Thomas E and Kaech Janie M
Bought by
South San Joaquin Irrigation District
Create a Home Valuation Report for This Property
The Home Valuation Report is an in-depth analysis detailing your home's value as well as a comparison with similar homes in the area
Purchase History
| Date | Buyer | Sale Price | Title Company |
|---|---|---|---|
| Anderson David G | $475,000 | First American Title | |
| Kaech Thomas E | -- | None Available | |
| Ballatore Bert M | -- | Accommodation | |
| South San Joaquin Irrigation District | $176 | -- |
Source: Public Records
Mortgage History
| Date | Status | Borrower | Loan Amount |
|---|---|---|---|
| Open | Anderson David G | $342,700 |
Source: Public Records
Tax History
| Year | Tax Paid | Tax Assessment Tax Assessment Total Assessment is a certain percentage of the fair market value that is determined by local assessors to be the total taxable value of land and additions on the property. | Land | Improvement |
|---|---|---|---|---|
| 2025 | $6,078 | $432,756 | $212,413 | $220,343 |
| 2024 | $5,865 | $425,674 | $208,249 | $217,425 |
| 2023 | $4,817 | $417,783 | $204,166 | $198,937 |
| 2022 | $4,543 | $409,660 | $200,163 | $209,497 |
| 2021 | $4,598 | $402,442 | $196,239 | $206,203 |
| 2020 | $4,570 | $399,640 | $194,227 | $205,413 |
| 2019 | $4,517 | $393,002 | $190,419 | $202,583 |
| 2018 | $4,483 | $387,191 | $186,686 | $200,505 |
| 2017 | $4,389 | $381,560 | $183,026 | $198,534 |
| 2016 | $4,354 | $376,429 | $179,438 | $196,991 |
| 2014 | $3,977 | $356,416 | $173,281 | $183,135 |
Source: Public Records
Map
Nearby Homes
- 22095 State Highway 120
- 22451 California 120
- 17751 Sexton Rd
- 20592 Ayers Rd
- 20339 Sexton Rd
- 16221 Carrolton Rd
- 0 Escalon_belotta Rd Unit 222110729
- 23873 State Highway 120
- 16166 Lawrence Rd
- 17576 E State Highway 120
- 19195 Dahlin Rd
- 1737 Sanchez Way
- 495 Valdapena Way
- 16929 Louise Ave
- 17230 E Franscella Ln
- 931 Park Ave
- 1260 Lillian Ave
- 1970 Mchenry Ave
- 2507 Escalon-Bellota Rd
- 1521 Deborah Cir
- 18565 S Van Allen Rd
- 18309 S Van Allen Rd
- 18312 S Van Allen Rd
- 18673 S Van Allen Rd
- 18661 S Van Allen Rd
- 18082 S Van Allen Rd
- 18794 S Van Allen Rd
- 18697 S Van Allen Rd
- 18061 S Van Allen Rd
- 20742 State Highway 120
- 18572 von Glahn Ave
- 17929 S Van Allen Rd
- 18983 S Van Allen Rd
- 18084 von Glahn Ave
- 18110 von Glahn Ave
- 18707 von Glahn Rd
- 18707 von Glahn Ave
- 20679 State Highway 120
- 18042 von Glahn Ave
- 19105 S Van Allen Rd
Your Personal Tour Guide
Ask me questions while you tour the home.