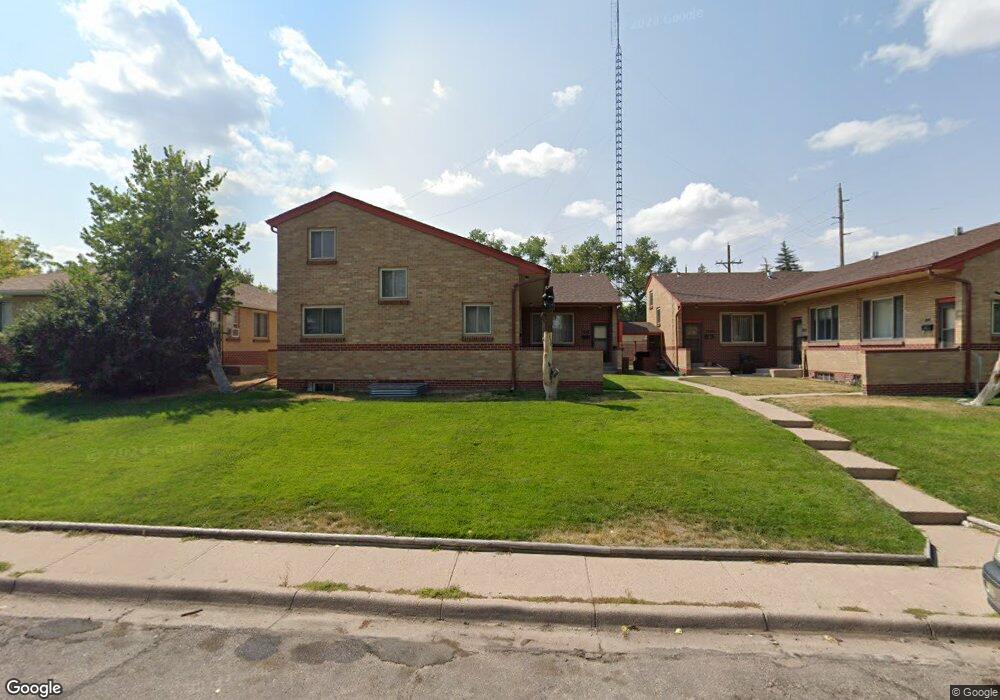
1844 Crook Ave Cheyenne, WY 82001
Mountview Park NeighborhoodEstimated Value: $407,000 - $828,992
--
Bed
4
Baths
2,465
Sq Ft
$233/Sq Ft
Est. Value
About This Home
This home is located at 1844 Crook Ave, Cheyenne, WY 82001 and is currently estimated at $573,748, approximately $232 per square foot. 1844 Crook Ave is a home with nearby schools including Henderson Elementary School, Carey Junior High School, and East High School.
Ownership History
Date
Name
Owned For
Owner Type
Purchase Details
Closed on
Jan 31, 2020
Sold by
Housley Thomas and Housley Martha Jane
Bought by
Housley Thomas and Housley Martha Jane
Current Estimated Value
Purchase Details
Closed on
Jul 7, 2006
Sold by
1844 Crook Llc
Bought by
Housley Thomas and Housley Martha
Home Financials for this Owner
Home Financials are based on the most recent Mortgage that was taken out on this home.
Original Mortgage
$135,000
Interest Rate
6.6%
Mortgage Type
Commercial
Purchase Details
Closed on
Sep 12, 2005
Sold by
Mueller Joseph W
Bought by
1844 Crook Llc
Purchase Details
Closed on
Jan 18, 2005
Sold by
1844 Crook Llc
Bought by
Mueller Joseph W
Home Financials for this Owner
Home Financials are based on the most recent Mortgage that was taken out on this home.
Original Mortgage
$26,700
Interest Rate
5.8%
Mortgage Type
New Conventional
Create a Home Valuation Report for This Property
The Home Valuation Report is an in-depth analysis detailing your home's value as well as a comparison with similar homes in the area
Home Values in the Area
Average Home Value in this Area
Purchase History
| Date | Buyer | Sale Price | Title Company |
|---|---|---|---|
| Housley Thomas | -- | None Available | |
| Housley Thomas | -- | Summit Title Services | |
| 1844 Crook Llc | -- | -- | |
| Mueller Joseph W | -- | -- |
Source: Public Records
Mortgage History
| Date | Status | Borrower | Loan Amount |
|---|---|---|---|
| Closed | Housley Thomas | $135,000 | |
| Previous Owner | Mueller Joseph W | $26,700 | |
| Previous Owner | Mueller Joseph W | $133,500 |
Source: Public Records
Tax History Compared to Growth
Tax History
| Year | Tax Paid | Tax Assessment Tax Assessment Total Assessment is a certain percentage of the fair market value that is determined by local assessors to be the total taxable value of land and additions on the property. | Land | Improvement |
|---|---|---|---|---|
| 2025 | $3,220 | $34,050 | $2,833 | $31,217 |
| 2024 | $3,220 | $45,537 | $3,777 | $41,760 |
| 2023 | $3,043 | $43,032 | $3,777 | $39,255 |
| 2022 | $2,761 | $38,247 | $3,777 | $34,470 |
| 2021 | $2,247 | $31,059 | $3,777 | $27,282 |
| 2020 | $2,058 | $28,533 | $3,777 | $24,756 |
| 2019 | $2,008 | $27,818 | $3,777 | $24,041 |
| 2018 | $1,967 | $27,497 | $3,677 | $23,820 |
| 2017 | $1,795 | $24,869 | $3,677 | $21,192 |
| 2016 | $1,699 | $23,532 | $3,677 | $19,855 |
| 2015 | $1,779 | $24,636 | $3,677 | $20,959 |
| 2014 | $1,720 | $23,661 | $3,677 | $19,984 |
Source: Public Records
Map
Nearby Homes
- 1837 Crook Ave
- 1869 Cherry Ct
- 2123 E 18th St
- 2407 E 16th St
- Tract 1 E Pershing Blvd
- TBD E Lincolnway
- 2632 Henderson Dr
- 1503 Converse Ave
- TBD Charles St
- 1551 Oak Ct
- 1519 Hot Springs Ave
- 1958 Newton Dr
- 2006 E 16th St
- 3444 Dover Rd
- Lot 1 E Phipps Ave
- 1509 Oak Ct
- 2015 E 15th St
- 1808 E 21st St
- 3849 E Lincolnway
- 1751 E Pershing Blvd
- 1854 Crook Ave
- 1953 Crook Ave
- 1834 Crook Ave
- 1853 Crook Ave
- 1853 Crook Ave Unit 3
- 2300 Chestnut Dr
- 1843 Crook Ave
- 1843 Crook Ave Unit 3
- 1847 Crook Ave
- 1847 Crook Ave Unit 3
- 1841 Crook Ave
- 1832 Crook Ave
- 1835 Converse Ave
- 2320 Chestnut Dr Unit 8
- 2320 Chestnut Dr Unit 5
- 2320 Chestnut Dr Unit 10
- 2320 Chestnut Dr Unit 6
- 2320 Chestnut Dr Unit 9
- 2320 Chestnut Dr Unit 7
- 2320 Chestnut Dr Unit 4