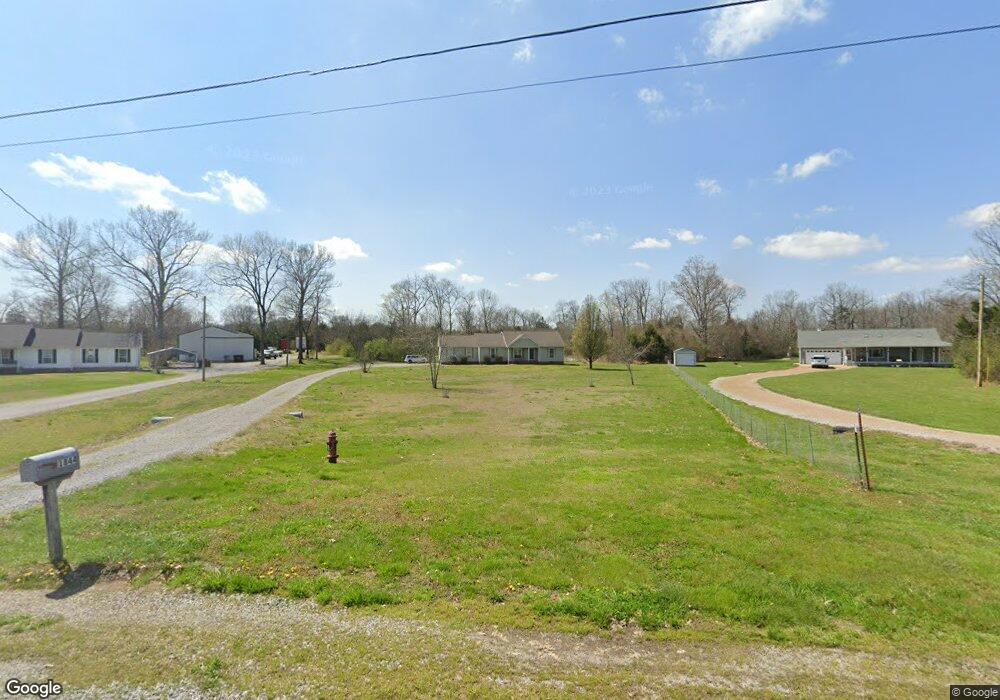
1844 Twin Caves Dr Lewisburg, TN 37091
Estimated Value: $252,000 - $401,000
--
Bed
2
Baths
1,511
Sq Ft
$216/Sq Ft
Est. Value
About This Home
This home is located at 1844 Twin Caves Dr, Lewisburg, TN 37091 and is currently estimated at $326,252, approximately $215 per square foot. 1844 Twin Caves Dr is a home located in Marshall County with nearby schools including Oak Grove Elementary School, Marshall Elementary School, and Westhills Elementary School.
Ownership History
Date
Name
Owned For
Owner Type
Purchase Details
Closed on
Jun 6, 2019
Sold by
Myers Burnes Randel
Bought by
Myers Ashley Kay
Current Estimated Value
Purchase Details
Closed on
Jul 12, 2013
Sold by
Myers Andrea Lynn
Bought by
Myers Burnes Randel
Purchase Details
Closed on
Oct 22, 2004
Sold by
Secretary Of Veterans
Bought by
Burnes Myers
Purchase Details
Closed on
Sep 29, 2004
Bought by
Myers Burnes Randel and Myers Andrea Lynn
Purchase Details
Closed on
Jun 4, 2003
Sold by
Derek Ogea and Derek Leigh *
Bought by
Veterans Affairs
Purchase Details
Closed on
May 22, 2003
Bought by
Secretary Of Veterans Aff Prop Disposition Br
Purchase Details
Closed on
Jul 29, 1999
Sold by
Roberts Chalrs E
Bought by
Ogea Derek M
Purchase Details
Closed on
Oct 16, 1992
Bought by
Roberts Edward Bay and Roberts Mary Ann
Create a Home Valuation Report for This Property
The Home Valuation Report is an in-depth analysis detailing your home's value as well as a comparison with similar homes in the area
Home Values in the Area
Average Home Value in this Area
Purchase History
| Date | Buyer | Sale Price | Title Company |
|---|---|---|---|
| Myers Ashley Kay | -- | -- | |
| Myers Burnes Randel | -- | -- | |
| Burnes Myers | $108,681 | -- | |
| Myers Burnes Randel | $108,700 | -- | |
| Veterans Affairs | $83,724 | -- | |
| Secretary Of Veterans Aff Prop Disposition Br | $83,700 | -- | |
| Ogea Derek M | $101,900 | -- | |
| Roberts Edward Bay | $32,500 | -- |
Source: Public Records
Tax History Compared to Growth
Tax History
| Year | Tax Paid | Tax Assessment Tax Assessment Total Assessment is a certain percentage of the fair market value that is determined by local assessors to be the total taxable value of land and additions on the property. | Land | Improvement |
|---|---|---|---|---|
| 2024 | $1,233 | $67,800 | $21,225 | $46,575 |
| 2023 | $1,233 | $67,800 | $21,225 | $46,575 |
| 2022 | $1,233 | $67,800 | $21,225 | $46,575 |
| 2021 | $1,059 | $37,650 | $10,025 | $27,625 |
| 2020 | $1,059 | $37,650 | $10,025 | $27,625 |
| 2019 | $1,059 | $37,650 | $10,025 | $27,625 |
| 2018 | $1,038 | $37,600 | $10,025 | $27,575 |
| 2017 | $1,038 | $37,600 | $10,025 | $27,575 |
| 2016 | $993 | $30,825 | $7,500 | $23,325 |
| 2015 | $993 | $30,825 | $7,500 | $23,325 |
| 2014 | $993 | $30,825 | $7,500 | $23,325 |
Source: Public Records
Map
Nearby Homes
- 1798 Twin Caves Dr
- 2001 Highway 40
- 1830 Bethbirei Rd
- 0 Wallace Thompson Rd
- 1755 Mcbride Rd
- 2150 Highway 40
- 1800 Mcbride Rd
- 1816 Wade Brown Rd
- 1820 Wade Brown Rd
- 1401 Hobby Ln
- 1510 Wade Brown Rd
- 2220 Hunter Bills Rd
- 2159 Verona Caney Rd
- 3077 Nashville Hwy
- 3130 Nashville Hwy
- 1529 Joanne Cir
- 1408 Holly Grove Rd
- 2421 Anes Station Rd
- 341 Holly Grove Rd
- 1465 Old Farmington Rd
- 1840 Twin Caves Dr
- 1848 Twin Caves Dr
- 1836 Twin Caves Dr
- 1845 Twin Caves Dr
- 1825 Twin Caves Dr
- 2421 Old Farmington Rd
- 1832 Twin Caves Rd
- 2427 Old Farmington Rd
- 1873 Twin Caves Dr
- 1821 Twin Caves Dr
- 2418 Old Farmington Rd
- 2433 Old Farmington Rd
- 1824 Twin Caves Dr
- 1817 Twin Caves Dr
- 2439 Old Farmington Rd
- 2445 Old Farmington Rd
- 1813 Twin Caves Dr
- 1809 Twin Caves Dr
- 1805 Twin Caves Dr
- 1816 Twin Caves Dr