Estimated Value: $723,708 - $781,000
5
Beds
4
Baths
3,906
Sq Ft
$191/Sq Ft
Est. Value
About This Home
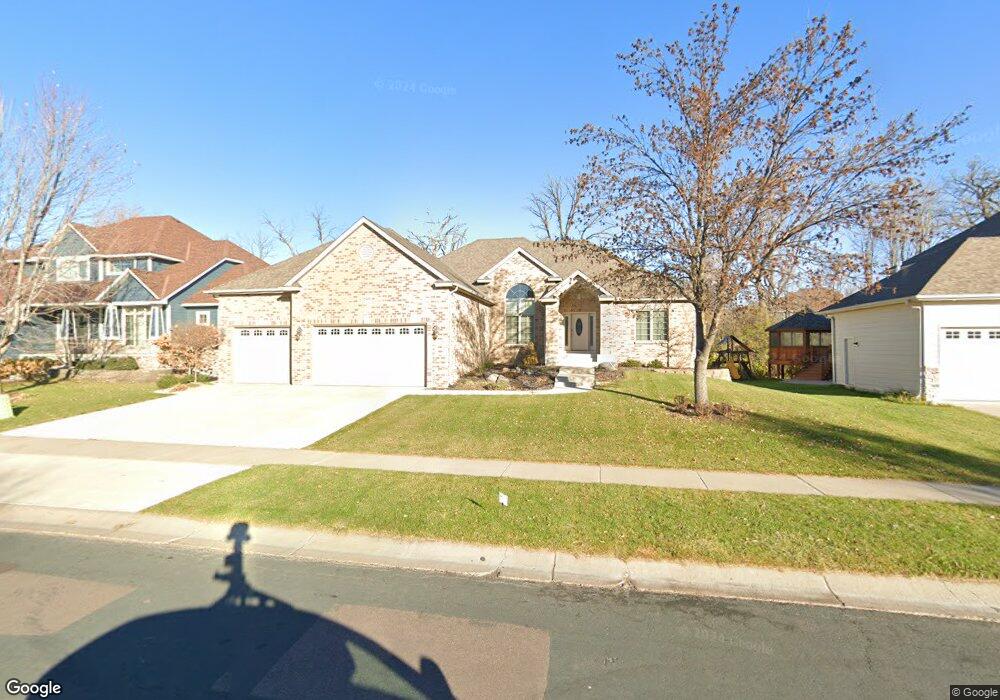
This home is located at 18448 98th Place N, Osseo, MN 55311 and is currently estimated at $745,677, approximately $190 per square foot. 18448 98th Place N is a home located in Hennepin County with nearby schools including Fernbrook Elementary School, Osseo Middle School, and Maple Grove Senior High School.
Ownership History
Date
Name
Owned For
Owner Type
Purchase Details
Closed on
Apr 1, 2021
Sold by
Hallstead Marsha A
Bought by
Profaizer John R and Profaizer Melissa T
Current Estimated Value
Home Financials for this Owner
Home Financials are based on the most recent Mortgage that was taken out on this home.
Original Mortgage
$150,000
Outstanding Balance
$134,993
Interest Rate
2.8%
Mortgage Type
New Conventional
Estimated Equity
$610,684
Purchase Details
Closed on
Jan 31, 2008
Sold by
Weichert Relocation Resources Inc
Bought by
Hallstead William J and Hallstead Marsha A
Purchase Details
Closed on
Nov 17, 2006
Sold by
Qualls Robert M and Qualls Peggy R
Bought by
Weichert Relocation Resources Inc
Purchase Details
Closed on
May 2, 2005
Sold by
Timberwood Homes Inc
Bought by
Qualls Robert M and Qualls Peggy R
Purchase Details
Closed on
Sep 2, 2003
Sold by
Janco Inc
Bought by
Timberwood Homes Inc
Create a Home Valuation Report for This Property
The Home Valuation Report is an in-depth analysis detailing your home's value as well as a comparison with similar homes in the area
Home Values in the Area
Average Home Value in this Area
Purchase History
| Date | Buyer | Sale Price | Title Company |
|---|---|---|---|
| Profaizer John R | $627,000 | Chicago Title Insurance Co | |
| Hallstead William J | $590,000 | -- | |
| Weichert Relocation Resources Inc | $600,000 | -- | |
| Qualls Robert M | $580,000 | -- | |
| Timberwood Homes Inc | $115,000 | -- | |
| Profaizer John John | $627,000 | -- |
Source: Public Records
Mortgage History
| Date | Status | Borrower | Loan Amount |
|---|---|---|---|
| Open | Profaizer John R | $150,000 | |
| Closed | Profaizer John John | $150,000 |
Source: Public Records
Tax History Compared to Growth
Tax History
| Year | Tax Paid | Tax Assessment Tax Assessment Total Assessment is a certain percentage of the fair market value that is determined by local assessors to be the total taxable value of land and additions on the property. | Land | Improvement |
|---|---|---|---|---|
| 2024 | $8,840 | $689,000 | $129,400 | $559,600 |
| 2023 | $8,686 | $701,100 | $166,100 | $535,000 |
| 2022 | $6,466 | $650,000 | $104,500 | $545,500 |
| 2021 | $6,421 | $527,200 | $86,000 | $441,200 |
| 2020 | $6,905 | $516,800 | $56,300 | $460,500 |
| 2019 | $7,297 | $526,000 | $62,600 | $463,400 |
| 2018 | $7,378 | $524,900 | $61,600 | $463,300 |
| 2017 | $7,196 | $491,300 | $79,000 | $412,300 |
| 2016 | $7,088 | $477,100 | $76,500 | $400,600 |
| 2015 | $7,218 | $472,600 | $90,500 | $382,100 |
| 2014 | -- | $453,100 | $81,000 | $372,100 |
Source: Public Records
Map
Nearby Homes
- 9803 Vagabond Ln N
- 18502 97th Place N Unit 2204
- 10056 Walnut Grove Ln N
- 18080 100th Ct N
- 9872 Alvarado Ln N Unit 4803
- 18050 100th Ct N
- 10148 Shadyview Ln N
- 19086 100th Place N
- 10184 Queensland Ln N
- 10261 Shadyview Ln N
- Walton Plan at Evanswood
- Sutton Sport Plan at Evanswood
- Windom Plan at Evanswood
- Westley Sport Plan at Evanswood
- Belleville Plan at Evanswood
- Weston Sport Plan at Evanswood
- Richmond Plan at Evanswood
- Superior Sport Plan at Evanswood
- Hillsdale Plan at Evanswood
- Hillcrest Sport Plan at Evanswood
- 18416 98th Place N
- 18480 98th Place N
- 18449 18449 98th-Place-n
- 18394 98th Place N
- 18502 98th Place N
- 18401 99th Place N
- 18449 98th Place N
- 18417 98th Place N
- 18481 98th Place N
- 18379 99th Place N
- 18475 99th Place N
- 18395 98th Place N
- 18362 98th Place N
- 18534 98th Place N
- 18401 18401 99th-Place-n
- 18503 98th Place N
- 18433 99th Place N
- 18433 99th Place N
- 18362 18362 98th-Place-n
- 18450 98th Ave N