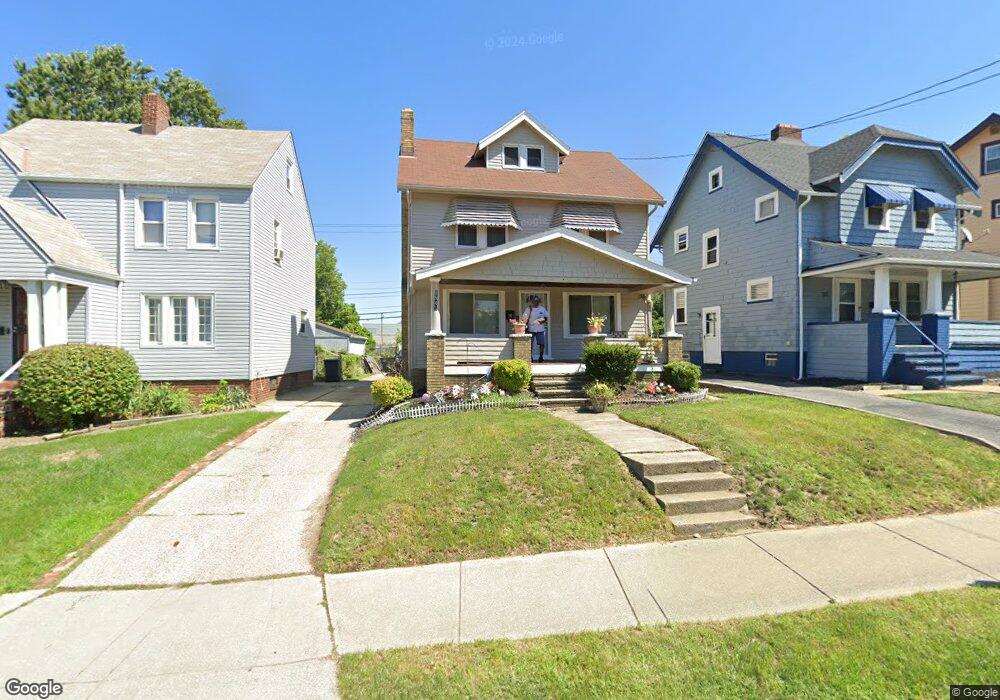
1845 Torbenson Dr Cleveland, OH 44112
Euclid-Green NeighborhoodEstimated Value: $72,734 - $117,000
4
Beds
1
Bath
1,506
Sq Ft
$66/Sq Ft
Est. Value
About This Home
This home is located at 1845 Torbenson Dr, Cleveland, OH 44112 and is currently estimated at $99,184, approximately $65 per square foot. 1845 Torbenson Dr is a home located in Cuyahoga County with nearby schools including Bolton, Anton Grdina School, and Andrew J. Rickoff School.
Ownership History
Date
Name
Owned For
Owner Type
Purchase Details
Closed on
Jun 28, 2016
Sold by
Wriaht Ramon T
Bought by
Tacken Man Michael B
Current Estimated Value
Purchase Details
Closed on
Oct 9, 2008
Sold by
Fannie Mae
Bought by
Wright Ramon
Purchase Details
Closed on
Apr 25, 2008
Sold by
Jackson Arron and Jackson Patricia
Bought by
Federal National Mortgage Association
Purchase Details
Closed on
Jan 24, 2005
Sold by
Jackson Patricia
Bought by
Jackson Aaron
Purchase Details
Closed on
Nov 1, 2004
Sold by
Jackson Aaron and Jackson Patricia
Bought by
Jackson Patricia
Purchase Details
Closed on
May 10, 1994
Sold by
Connolly James J
Bought by
Connolly Norah
Purchase Details
Closed on
Mar 7, 1979
Sold by
Connolly James J and Connolly Norah
Bought by
Connolly James J
Purchase Details
Closed on
Apr 5, 1976
Sold by
Connolly James J
Bought by
Connolly James J and Connolly Norah
Purchase Details
Closed on
Feb 5, 1976
Sold by
Connolly James J and Connolly Marie A
Bought by
James J Connolly
Purchase Details
Closed on
Jan 1, 1975
Bought by
Connolly James J and Connolly Marie A
Create a Home Valuation Report for This Property
The Home Valuation Report is an in-depth analysis detailing your home's value as well as a comparison with similar homes in the area
Home Values in the Area
Average Home Value in this Area
Purchase History
| Date | Buyer | Sale Price | Title Company |
|---|---|---|---|
| Tacken Man Michael B | -- | Attorney | |
| Wright Ramon | $6,000 | Accutitle Agency Inc | |
| Federal National Mortgage Association | $24,000 | Attorney | |
| Jackson Aaron | -- | -- | |
| Jackson Patricia | -- | -- | |
| Connolly Norah | -- | -- | |
| Connolly James J | -- | -- | |
| Connolly James J | -- | -- | |
| James J Connolly | -- | -- | |
| Connolly James J | -- | -- |
Source: Public Records
Tax History Compared to Growth
Tax History
| Year | Tax Paid | Tax Assessment Tax Assessment Total Assessment is a certain percentage of the fair market value that is determined by local assessors to be the total taxable value of land and additions on the property. | Land | Improvement |
|---|---|---|---|---|
| 2024 | $1,792 | $27,335 | $3,815 | $23,520 |
| 2023 | $1,264 | $16,660 | $2,380 | $14,280 |
| 2022 | $1,256 | $16,660 | $2,380 | $14,280 |
| 2021 | $1,244 | $16,660 | $2,380 | $14,280 |
| 2020 | $1,200 | $13,900 | $2,000 | $11,900 |
| 2019 | $1,137 | $39,700 | $5,700 | $34,000 |
| 2018 | $3,297 | $13,900 | $2,000 | $11,900 |
| 2017 | $1,373 | $16,240 | $3,850 | $12,390 |
| 2016 | $1,363 | $16,240 | $3,850 | $12,390 |
| 2015 | $4,460 | $16,240 | $3,850 | $12,390 |
| 2014 | $8,187 | $16,740 | $3,960 | $12,780 |
Source: Public Records
Map
Nearby Homes
- 1897 Torbenson Dr
- 1738 Burgess Rd
- 1738 Cliffview Rd
- 18001 Olympia Rd
- 1677 Hillview Rd
- 1682 Cliffview Rd
- 1767 Algonac Rd Unit 2
- 1758 Algonac Rd
- 1646 Avalon Rd
- 1777 Catalpa Rd
- 1651 Avalon Rd
- 1639 Avalon Rd
- 1707 Catalpa Rd
- 18132 Weston Rd
- 940 London Rd
- 2116 Reyburn Rd
- 1875 Lampson Rd
- 3595 Runnymede Blvd
- 949 Rudyard Rd
- 2133 Reyburn Rd
- 1849 Torbenson Dr
- 1841 Torbenson Dr
- 1853 Torbenson Dr
- 1837 Torbenson Dr
- 1831 Torbenson Dr
- 1844 Torbenson Dr
- 1861 Torbenson Dr
- 1840 Torbenson Dr
- 1848 Torbenson Dr
- 1836 Torbenson Dr
- 1852 Torbenson Dr
- 1832 Torbenson Dr
- 1856 Torbenson Dr
- 1860 Torbenson Dr
- 1864 Torbenson Dr
- 1825 Torbenson Dr
- 1868 Torbenson Dr
- 1828 Torbenson Dr
- 1824 Torbenson Dr
- 1872 Torbenson Dr