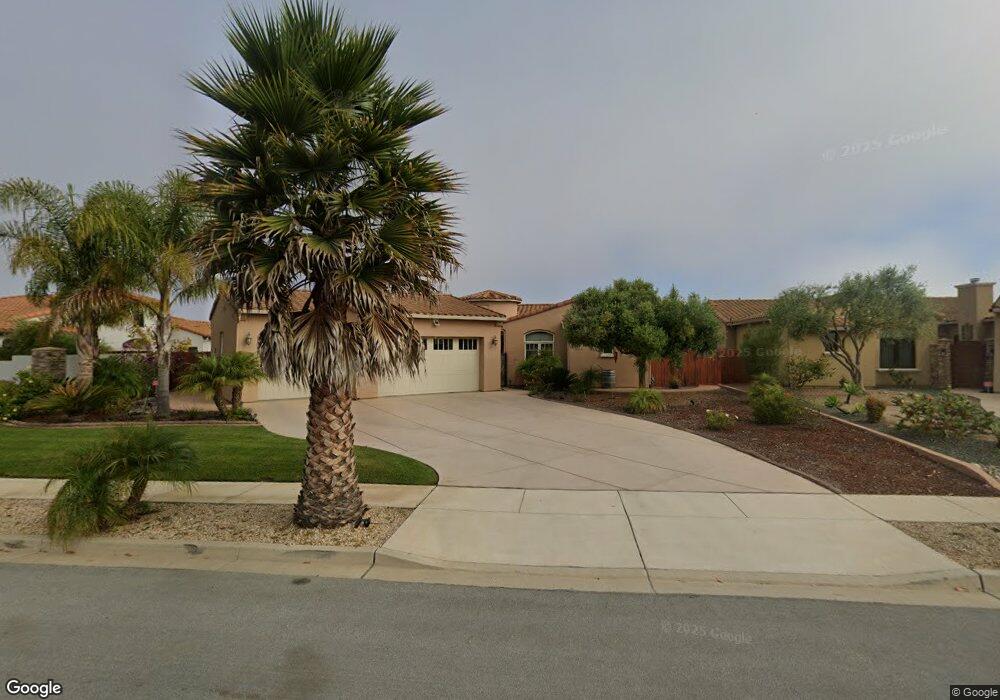
1845 Vista Del Pueblo Nipomo, CA 93444
Estimated Value: $1,146,840 - $1,332,000
4
Beds
4
Baths
3,111
Sq Ft
$399/Sq Ft
Est. Value
About This Home
This home is located at 1845 Vista Del Pueblo, Nipomo, CA 93444 and is currently estimated at $1,241,960, approximately $399 per square foot. 1845 Vista Del Pueblo is a home located in San Luis Obispo County with nearby schools including Dorothea Lange Elementary School, Mesa Middle School, and Nipomo High School.
Ownership History
Date
Name
Owned For
Owner Type
Purchase Details
Closed on
Jan 30, 2015
Sold by
Nguyen Kiet A
Bought by
Kiet Nguyen and Kiet Thuy Duong
Current Estimated Value
Purchase Details
Closed on
Nov 7, 2014
Sold by
Dao Thuy Duong
Bought by
Nguyen Kiet A
Purchase Details
Closed on
Aug 22, 2014
Sold by
Res Ca Mv Estates Llc
Bought by
Nguyen Kiet A
Home Financials for this Owner
Home Financials are based on the most recent Mortgage that was taken out on this home.
Original Mortgage
$447,585
Interest Rate
2.87%
Mortgage Type
Adjustable Rate Mortgage/ARM
Purchase Details
Closed on
Sep 2, 2011
Sold by
Maria Vista Estates
Bought by
Res Ca Mv Estates Llc
Create a Home Valuation Report for This Property
The Home Valuation Report is an in-depth analysis detailing your home's value as well as a comparison with similar homes in the area
Home Values in the Area
Average Home Value in this Area
Purchase History
| Date | Buyer | Sale Price | Title Company |
|---|---|---|---|
| Kiet Nguyen | -- | Public | |
| Nguyen Kiet A | -- | First American Title Company | |
| Nguyen Kiet A | $559,500 | First American Title Company | |
| Res Ca Mv Estates Llc | $3,000,000 | First American Title Co |
Source: Public Records
Mortgage History
| Date | Status | Borrower | Loan Amount |
|---|---|---|---|
| Previous Owner | Nguyen Kiet A | $447,585 |
Source: Public Records
Tax History Compared to Growth
Tax History
| Year | Tax Paid | Tax Assessment Tax Assessment Total Assessment is a certain percentage of the fair market value that is determined by local assessors to be the total taxable value of land and additions on the property. | Land | Improvement |
|---|---|---|---|---|
| 2025 | $6,982 | $672,305 | $192,291 | $480,014 |
| 2024 | $6,884 | $659,123 | $188,521 | $470,602 |
| 2023 | $6,884 | $646,200 | $184,825 | $461,375 |
| 2022 | $6,774 | $633,530 | $181,201 | $452,329 |
| 2021 | $7,091 | $621,109 | $177,649 | $443,460 |
| 2020 | $6,676 | $614,741 | $175,828 | $438,913 |
| 2019 | $6,636 | $602,688 | $172,381 | $430,307 |
| 2018 | $6,558 | $590,871 | $169,001 | $421,870 |
| 2017 | $6,432 | $579,287 | $165,688 | $413,599 |
| 2016 | $6,069 | $567,930 | $162,440 | $405,490 |
| 2015 | $5,979 | $559,400 | $160,000 | $399,400 |
| 2014 | $2,169 | $206,231 | $51,231 | $155,000 |
Source: Public Records
Map
Nearby Homes
- 860 Vista Del Rio
- 1950 Vista Del Sol
- 611 Mayten St
- 2247 Lexington Ave
- 2205 Vista Promesa
- 2219 Iliff Ln
- 2148 Avenida Redondo
- 829 Vista Montana
- 906 Vista Montana
- 519 W Taylor St Unit 371
- 519 W Taylor St Unit 406
- 519 W Taylor St Unit 125
- 0 Preisker Ln
- 1725 Dejoy St
- 510 E Taft St
- 1503 N Blosser Rd
- 1011 W Harding Ave
- 438 W Harding Ave
- 1412 N Smith St
- 1700 Lynne Dr Unit 17
- 1855 Vista Del Pueblo
- 1835 Vista Del Pueblo
- 1860 Vista Del Pueblo
- 1825 Vista Del Pueblo
- 1875 Vista Del Pueblo
- 1848 Vista Del Pueblo
- 1836 Vista Del Pueblo
- 1824 Vista Del Pueblo
- 1885 Vista Del Pueblo
- 1872 Vista Del Pueblo
- 1860 Santa Maria Vista
- 1860 Santa Maria Vista Unit LT 21
- 1860 Vista Santa Maria
- 780 Vista Del Rio Unit LT 12
- 780 Vista Del Rio
- 1856 Santa Maria Vista
- 1856 Santa Maria Vista Unit LT 20
- 1856 Vista Santa Maria
- 770 Vista Del Rio Unit LT 11
- 770 Vista Del Rio