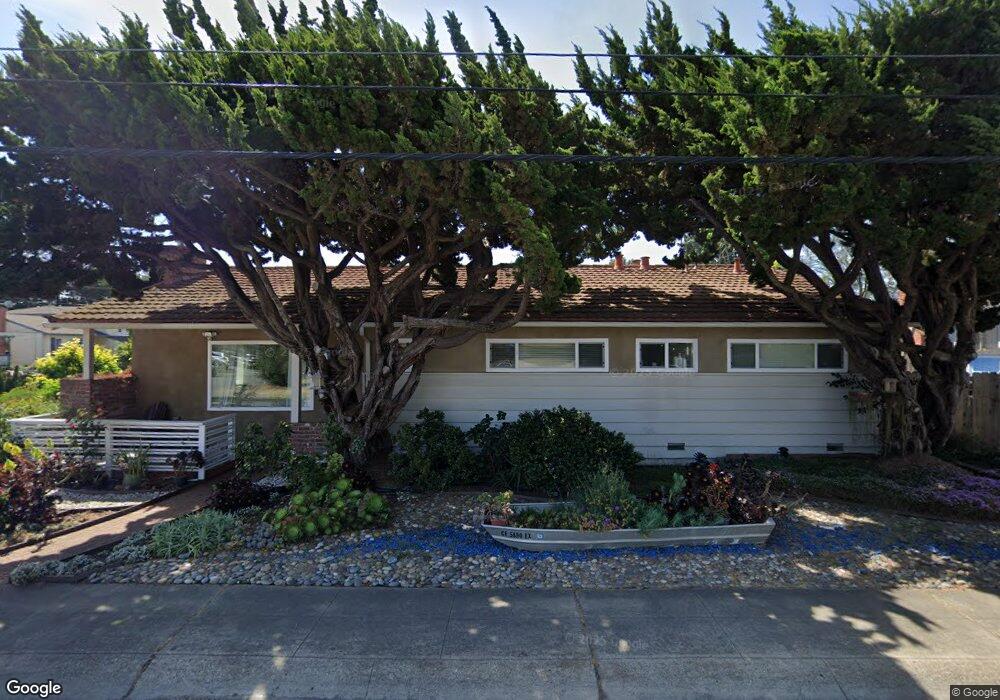
18451 Via Arriba San Lorenzo, CA 94580
Estimated Value: $809,000 - $997,000
3
Beds
2
Baths
1,582
Sq Ft
$575/Sq Ft
Est. Value
About This Home
This home is located at 18451 Via Arriba, San Lorenzo, CA 94580 and is currently estimated at $910,429, approximately $575 per square foot. 18451 Via Arriba is a home located in Alameda County with nearby schools including Del Rey Elementary School, Bohannon Middle School, and Arroyo High School.
Ownership History
Date
Name
Owned For
Owner Type
Purchase Details
Closed on
Apr 21, 2023
Sold by
Long Terrence Lynn
Bought by
Lin Zimei
Current Estimated Value
Purchase Details
Closed on
Sep 16, 2015
Sold by
Vpi Llc
Bought by
Long Terrence Lynn and Lin Zimei
Home Financials for this Owner
Home Financials are based on the most recent Mortgage that was taken out on this home.
Original Mortgage
$400,000
Interest Rate
3.9%
Mortgage Type
New Conventional
Purchase Details
Closed on
May 20, 2015
Sold by
Jones Darlene M and Jones Trust
Bought by
Vpi Llc
Home Financials for this Owner
Home Financials are based on the most recent Mortgage that was taken out on this home.
Original Mortgage
$190,000
Interest Rate
3.63%
Mortgage Type
Purchase Money Mortgage
Purchase Details
Closed on
May 19, 2003
Sold by
Jones Robert I and Jones Edith Lorene
Bought by
Jones Robert L and Jones Edith Lorene
Create a Home Valuation Report for This Property
The Home Valuation Report is an in-depth analysis detailing your home's value as well as a comparison with similar homes in the area
Home Values in the Area
Average Home Value in this Area
Purchase History
| Date | Buyer | Sale Price | Title Company |
|---|---|---|---|
| Lin Zimei | -- | Accommodation/Courtesy Recordi | |
| Long Terrence Lynn | $582,000 | North American Title Co Inc | |
| Vpi Llc | $410,000 | North American Title Co Inc | |
| Jones Robert L | -- | -- |
Source: Public Records
Mortgage History
| Date | Status | Borrower | Loan Amount |
|---|---|---|---|
| Previous Owner | Long Terrence Lynn | $400,000 | |
| Previous Owner | Vpi Llc | $190,000 |
Source: Public Records
Tax History Compared to Growth
Tax History
| Year | Tax Paid | Tax Assessment Tax Assessment Total Assessment is a certain percentage of the fair market value that is determined by local assessors to be the total taxable value of land and additions on the property. | Land | Improvement |
|---|---|---|---|---|
| 2025 | $8,894 | $688,953 | $206,686 | $482,267 |
| 2024 | $8,894 | $675,445 | $202,633 | $472,812 |
| 2023 | $8,765 | $662,204 | $198,661 | $463,543 |
| 2022 | $8,643 | $649,220 | $194,766 | $454,454 |
| 2021 | $8,411 | $636,491 | $190,947 | $445,544 |
| 2020 | $8,237 | $629,967 | $188,990 | $440,977 |
| 2019 | $8,257 | $617,617 | $185,285 | $432,332 |
| 2018 | $7,829 | $605,511 | $181,653 | $423,858 |
| 2017 | $7,623 | $593,640 | $178,092 | $415,548 |
| 2016 | $7,130 | $582,000 | $174,600 | $407,400 |
| 2015 | $1,441 | $89,557 | $40,188 | $49,369 |
| 2014 | $1,418 | $87,803 | $39,401 | $48,402 |
Source: Public Records
Map
Nearby Homes
- 18251 Via Jose
- 19150 Hesperian Blvd Unit 19
- 17761 Via Arriba
- 18018 Sahara Rd
- 819 Bockman Rd
- 769 Bartlett Ave
- 18003 Incline Place
- 17347 Via Encinas
- 18005 Sunol Rd
- 17316 Via Flores
- 19665 Royal Ave
- 825 W A St Unit 1
- 823 W A St Unit 2
- 821 W A St
- 19390 Hesperian Blvd
- 17354 Via el Cerrito
- 1401 Via Coralla
- 72 Via Morella
- 1311 Via Manzanas
- 21824 Thelma St
- 18501 Via Arriba
- 824 Via Poudre
- 18551 Via Arriba
- 18351 Via Arriba
- 836 Via Poudre
- 18450 Via Arriba
- 823 Via Poudre
- 18500 Via Arriba
- 18601 Via Arriba
- 18400 Via Arriba
- 18580 Via Jose
- 18301 Via Arriba
- 835 Via Poudre
- 18596 Via Jose
- 18550 Via Arriba
- 18350 Via Arriba
- 848 Via Poudre
- 18651 Via Arriba
- 18600 Via Arriba
- 18251 Via Arriba