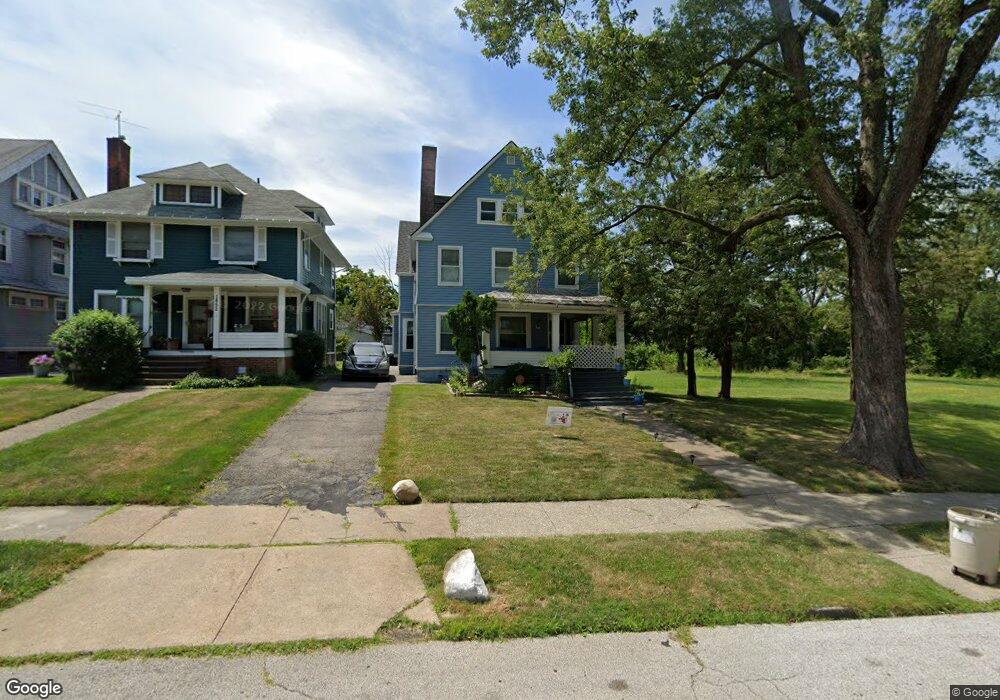
1846 Allandale Ave Cleveland, OH 44112
Estimated Value: $89,000 - $169,000
4
Beds
2
Baths
2,028
Sq Ft
$57/Sq Ft
Est. Value
About This Home
This home is located at 1846 Allandale Ave, Cleveland, OH 44112 and is currently estimated at $114,619, approximately $56 per square foot. 1846 Allandale Ave is a home located in Cuyahoga County with nearby schools including A.C. Jones Health Professions Magnet Academy, Shaw High School, and Apex Academy.
Ownership History
Date
Name
Owned For
Owner Type
Purchase Details
Closed on
Sep 2, 1998
Sold by
Brown Juanita and Brown Alex C
Bought by
Brown Clarence and Brown Juanita
Current Estimated Value
Home Financials for this Owner
Home Financials are based on the most recent Mortgage that was taken out on this home.
Original Mortgage
$16,099
Interest Rate
7.06%
Purchase Details
Closed on
May 28, 1993
Sold by
Freeman Roberta F
Bought by
Brown Juanita
Purchase Details
Closed on
Dec 12, 1977
Sold by
Freeman Roberta F
Bought by
Freeman Roberta F
Purchase Details
Closed on
Apr 18, 1977
Bought by
Freeman Roberta F
Purchase Details
Closed on
Oct 26, 1976
Bought by
East Cleveland Community
Purchase Details
Closed on
May 6, 1976
Sold by
Byrd Sarah R
Bought by
Mellon Natl Mortgage Co
Purchase Details
Closed on
Jan 1, 1975
Bought by
Byrd Sarah R
Create a Home Valuation Report for This Property
The Home Valuation Report is an in-depth analysis detailing your home's value as well as a comparison with similar homes in the area
Home Values in the Area
Average Home Value in this Area
Purchase History
| Date | Buyer | Sale Price | Title Company |
|---|---|---|---|
| Brown Clarence | -- | -- | |
| Brown Juanita | $50,000 | -- | |
| Freeman Roberta F | -- | -- | |
| Freeman Roberta F | $23,000 | -- | |
| East Cleveland Community | -- | -- | |
| East Cleveland City Of | -- | -- | |
| Mellon Natl Mortgage Co | $21,500 | -- | |
| Secretary Of Hud | -- | -- | |
| Byrd Sarah R | -- | -- |
Source: Public Records
Mortgage History
| Date | Status | Borrower | Loan Amount |
|---|---|---|---|
| Closed | Brown Clarence | $16,099 |
Source: Public Records
Tax History Compared to Growth
Tax History
| Year | Tax Paid | Tax Assessment Tax Assessment Total Assessment is a certain percentage of the fair market value that is determined by local assessors to be the total taxable value of land and additions on the property. | Land | Improvement |
|---|---|---|---|---|
| 2024 | $1,311 | $19,740 | $4,375 | $15,365 |
| 2023 | $1,114 | $11,380 | $2,310 | $9,070 |
| 2022 | $1,111 | $11,380 | $2,310 | $9,070 |
| 2021 | $1,102 | $11,380 | $2,310 | $9,070 |
| 2020 | $1,200 | $11,590 | $2,350 | $9,240 |
| 2019 | $1,252 | $33,100 | $6,700 | $26,400 |
| 2018 | $1,247 | $11,590 | $2,350 | $9,240 |
| 2017 | $1,402 | $14,320 | $4,030 | $10,290 |
| 2016 | $1,391 | $14,320 | $4,030 | $10,290 |
| 2015 | $2,300 | $14,320 | $4,030 | $10,290 |
| 2014 | $2,300 | $16,840 | $4,730 | $12,110 |
Source: Public Records
Map
Nearby Homes
- 1854 Hastings Ave
- 1731 Taylor Rd
- 1851 Sheldon Ave
- 1770 Alcoy Rd
- 1762 Alcoy Rd
- 14725 Elm Ave
- 14810 Shaw Ave
- 1872 Lampson Rd
- 14705 Alder Ave
- 935 Ravine Dr
- 1816 Lampson Rd
- 15018 Terrace Rd
- 14615 Elm Ave
- 861 Caledonia Ave
- 1875 Lampson Rd
- 936 Dresden Rd
- 945 Dresden Rd
- 1369 Hampton Rd
- 14500 Alder Ave
- 841 Helmsdale Rd
- 1842 Allandale Ave
- 1852 Allandale Ave
- 1854 Allandale Ave
- 1838 Allandale Ave
- 1858 Allandale Ave
- 1832 Allandale Ave
- 1843 Burnette Ave
- 1847 Burnette Ave
- 1839 Burnette Ave
- 1835 Burnette Ave
- 1851 Burnette Ave
- 1864 Allandale Ave
- 1828 Allandale Ave
- 1831 Burnette Ave
- 1857 Burnette Ave
- 1849 Allandale Ave
- 1868 Allandale Ave
- 1829 Burnette Ave
- 1859 Burnette Ave
- 1845 Allandale Ave