1846 Edenwald Ave Bronx, NY 10466
Wakefield NeighborhoodEstimated Value: $694,951 - $742,000
3
Beds
3
Baths
2,500
Sq Ft
$288/Sq Ft
Est. Value
About This Home
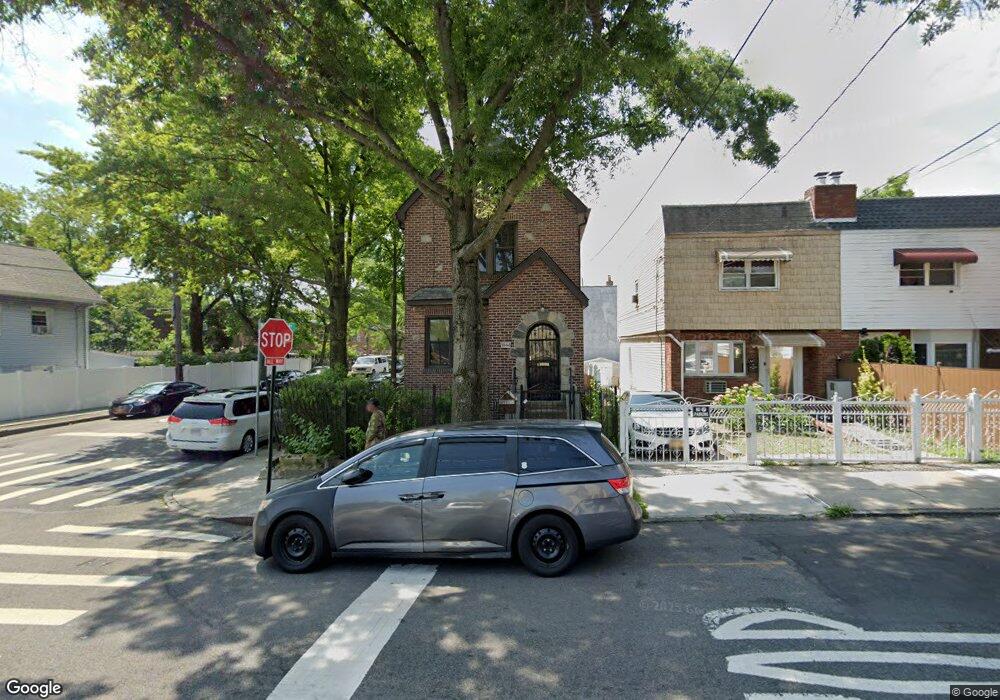
This home is located at 1846 Edenwald Ave, Bronx, NY 10466 and is currently estimated at $719,488, approximately $287 per square foot. 1846 Edenwald Ave is a home located in Bronx County with nearby schools including P.S. 87, One World Middle School At Edenwald, and Baychester Middle School.
Ownership History
Date
Name
Owned For
Owner Type
Purchase Details
Closed on
Nov 16, 2009
Sold by
Evelyn Alexander As Co-Trustee
Bought by
Yan Chaowen and Zhu Jing
Current Estimated Value
Home Financials for this Owner
Home Financials are based on the most recent Mortgage that was taken out on this home.
Original Mortgage
$220,000
Outstanding Balance
$143,063
Interest Rate
4.92%
Estimated Equity
$576,426
Purchase Details
Closed on
Aug 17, 2005
Sold by
Alexander Evelyn C and Alexander Paul
Bought by
Evelyn C Alexander Living Trust Dated 8 and Paul Alexander Living Trust Dated /0
Purchase Details
Closed on
May 21, 1999
Sold by
Maxwell Selwyn and Maxwell Eunice
Bought by
Alexander Paul and Alexander Evelyn C
Home Financials for this Owner
Home Financials are based on the most recent Mortgage that was taken out on this home.
Original Mortgage
$193,800
Interest Rate
7.76%
Mortgage Type
VA
Create a Home Valuation Report for This Property
The Home Valuation Report is an in-depth analysis detailing your home's value as well as a comparison with similar homes in the area
Home Values in the Area
Average Home Value in this Area
Purchase History
| Date | Buyer | Sale Price | Title Company |
|---|---|---|---|
| Yan Chaowen | $407,000 | -- | |
| Yan Chaowen | $407,000 | -- | |
| Evelyn C Alexander Living Trust Dated 8 | -- | -- | |
| Evelyn C Alexander Living Trust Dated 8 | -- | -- | |
| Alexander Paul | $190,000 | Record & Return Title Agency | |
| Alexander Paul | $190,000 | Record & Return Title Agency |
Source: Public Records
Mortgage History
| Date | Status | Borrower | Loan Amount |
|---|---|---|---|
| Open | Yan Chaowen | $220,000 | |
| Closed | Yan Chaowen | $220,000 | |
| Previous Owner | Alexander Paul | $193,800 |
Source: Public Records
Tax History Compared to Growth
Tax History
| Year | Tax Paid | Tax Assessment Tax Assessment Total Assessment is a certain percentage of the fair market value that is determined by local assessors to be the total taxable value of land and additions on the property. | Land | Improvement |
|---|---|---|---|---|
| 2025 | $6,063 | $31,830 | $5,549 | $26,281 |
| 2024 | $6,063 | $31,589 | $6,559 | $25,030 |
| 2023 | $5,768 | $29,802 | $6,250 | $23,552 |
| 2022 | $5,326 | $32,340 | $7,500 | $24,840 |
| 2021 | $5,279 | $33,060 | $7,500 | $25,560 |
| 2020 | $5,319 | $28,620 | $7,500 | $21,120 |
| 2019 | $5,214 | $28,620 | $7,500 | $21,120 |
| 2018 | $4,765 | $24,835 | $7,104 | $17,731 |
| 2017 | $4,477 | $23,430 | $6,353 | $17,077 |
| 2016 | $4,109 | $22,104 | $6,563 | $15,541 |
| 2015 | $2,446 | $22,104 | $6,828 | $15,276 |
| 2014 | $2,446 | $21,937 | $8,067 | $13,870 |
Source: Public Records
Map
Nearby Homes
- 4070 Bruner Ave
- 1906 Edenwald Ave
- 4069 Grace Ave
- 4086 Grace Ave
- 4026 Wickham Ave
- 4051 Grace Ave
- 4018A Bruner Ave
- 4114 Wickham Ave
- 4122 Wickham Ave
- 1779 Edenwald Ave
- 1073 E 233rd St
- 1777 Edenwald Ave
- 4126 Gunther Ave
- 1012 E 233rd St
- 4153 Bruner Ave
- 4149 Edson Ave
- 1761 Edenwald Ave
- 4167 Bruner Ave
- 4178 Paulding Ave
- 4143 Baychester Ave
- 1840 Edenwald Ave
- 1836 Edenwald Ave
- 4085 Ely Ave
- 1902 Edenwald Ave
- 1832 Edenwald Ave
- 4081 Ely Ave
- 1904 Edenwald Ave
- 4079 Ely Ave
- 4090 Ely Ave
- 1828 Edenwald Ave
- 4077 Ely Ave
- 4077 Ely Ave Unit 1
- 4088 Ely Ave
- 4064 Bruner Ave
- 4064 Bruner Ave Unit 1
- 1908 Edenwald Ave
- 4086 Ely Ave
- 4075 Ely Ave
- 4084 Ely Ave
- 4060 Bruner Ave