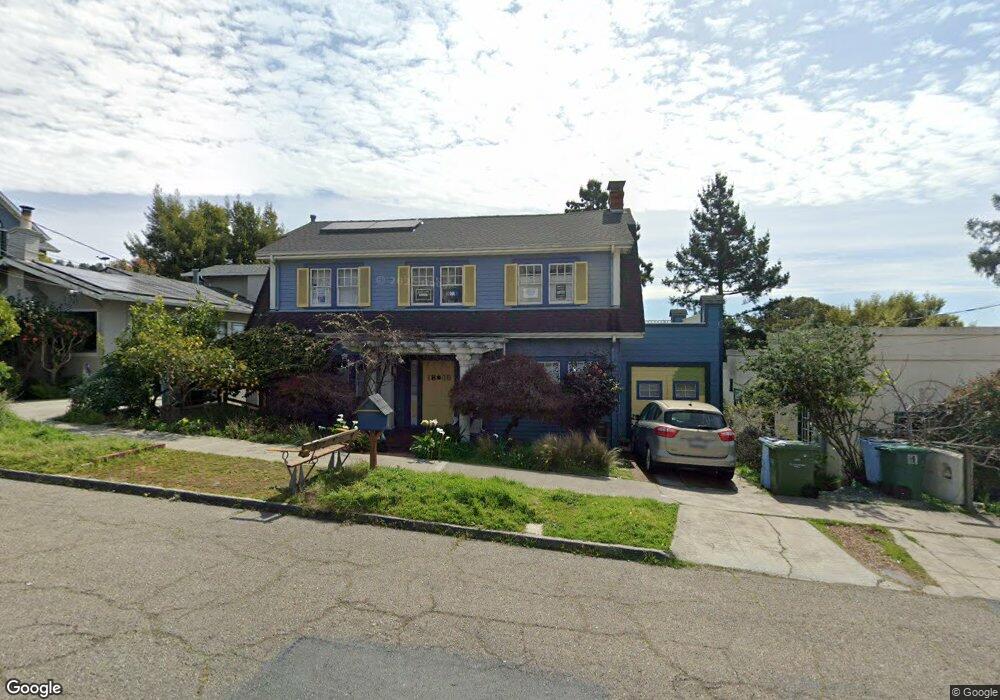
1846 San Lorenzo Ave Berkeley, CA 94707
Thousand Oaks NeighborhoodEstimated Value: $1,650,000 - $2,045,000
3
Beds
2
Baths
1,904
Sq Ft
$969/Sq Ft
Est. Value
About This Home
This home is located at 1846 San Lorenzo Ave, Berkeley, CA 94707 and is currently estimated at $1,845,699, approximately $969 per square foot. 1846 San Lorenzo Ave is a home located in Alameda County with nearby schools including Thousand Oaks Elementary School, Ruth Acty Elementary, and Berkeley Arts Magnet at Whittier School.
Ownership History
Date
Name
Owned For
Owner Type
Purchase Details
Closed on
Jun 1, 2011
Sold by
Schwin Kass
Bought by
Quinn Alexander and Quinn Jennifer
Current Estimated Value
Purchase Details
Closed on
Nov 19, 2001
Sold by
Schwin Kass
Bought by
Schwin Kass
Home Financials for this Owner
Home Financials are based on the most recent Mortgage that was taken out on this home.
Original Mortgage
$314,000
Interest Rate
6.57%
Purchase Details
Closed on
May 2, 2001
Sold by
Schwin Kass Ann
Bought by
Schwin Kass Ann
Purchase Details
Closed on
Aug 2, 1994
Sold by
Schwin Joseph Dennis
Bought by
Schwin Kass Ann
Home Financials for this Owner
Home Financials are based on the most recent Mortgage that was taken out on this home.
Original Mortgage
$274,000
Interest Rate
5%
Create a Home Valuation Report for This Property
The Home Valuation Report is an in-depth analysis detailing your home's value as well as a comparison with similar homes in the area
Home Values in the Area
Average Home Value in this Area
Purchase History
| Date | Buyer | Sale Price | Title Company |
|---|---|---|---|
| Quinn Alexander | $740,000 | Old Republic Title Company | |
| Schwin Kass | -- | Old Republic Title Company | |
| Schwin Kass | -- | Alliance Title Company | |
| Schwin Kass Ann | -- | -- | |
| Schwin Kass Ann | -- | Chicago Title Company |
Source: Public Records
Mortgage History
| Date | Status | Borrower | Loan Amount |
|---|---|---|---|
| Previous Owner | Schwin Kass | $314,000 | |
| Previous Owner | Schwin Kass Ann | $274,000 |
Source: Public Records
Tax History Compared to Growth
Tax History
| Year | Tax Paid | Tax Assessment Tax Assessment Total Assessment is a certain percentage of the fair market value that is determined by local assessors to be the total taxable value of land and additions on the property. | Land | Improvement |
|---|---|---|---|---|
| 2025 | $15,421 | $941,013 | $284,404 | $663,609 |
| 2024 | $15,421 | $922,431 | $278,829 | $650,602 |
| 2023 | $15,091 | $911,213 | $273,364 | $637,849 |
| 2022 | $14,796 | $886,350 | $268,005 | $625,345 |
| 2021 | $14,817 | $868,834 | $262,750 | $613,084 |
| 2020 | $13,943 | $866,857 | $260,057 | $606,800 |
| 2019 | $13,314 | $849,867 | $254,960 | $594,907 |
| 2018 | $13,076 | $833,210 | $249,963 | $583,247 |
| 2017 | $12,623 | $816,878 | $245,063 | $571,815 |
| 2016 | $12,169 | $800,864 | $240,259 | $560,605 |
| 2015 | $11,999 | $788,840 | $236,652 | $552,188 |
| 2014 | $11,895 | $773,388 | $232,016 | $541,372 |
Source: Public Records
Map
Nearby Homes
- 1866 Tacoma Ave
- 1730 San Lorenzo Ave
- 734 Ensenada Ave
- 581 Arlington Ave
- 589 San Luis Rd
- 826 Indian Rock Ave
- 744 Coventry Rd
- 715 Santa Barbara Rd
- 85 Stratford Rd
- 74 Florida Ave
- 716 Coventry Rd
- 721 Pomona Ave
- 1614 Posen Ave
- 720 Key Route Blvd
- 614 Cragmont Ave
- 1175 Colusa Ave
- 1130 Oxford St
- 840 Key Route Blvd
- 1840 San Lorenzo Ave
- 1854 San Lorenzo Ave
- 1834 San Lorenzo Ave
- 1831 Capistrano Ave
- 1858 San Lorenzo Ave
- 1827 Capistrano Ave
- 690 Santa Rosa Ave
- 1843 Capistrano Ave
- 1821 Capistrano Ave
- 1830 San Lorenzo Ave
- 1864 San Lorenzo Ave
- 1837 San Lorenzo Ave
- 1817 Capistrano Ave
- 1845 Capistrano Ave
- 1863 San Lorenzo Ave
- 1824 San Lorenzo Ave
- 1870 San Lorenzo Ave
- 1829 San Lorenzo Ave
- 699 Santa Rosa Ave
- 693 Santa Rosa Ave