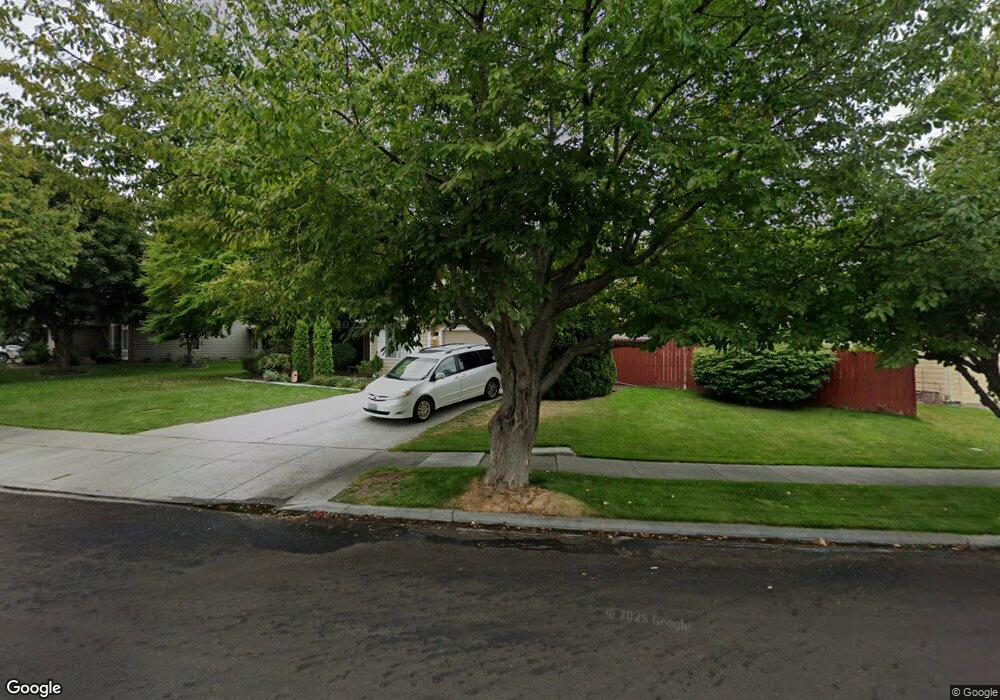
1847 Newhaven Loop Unit Unbeatable Price in Richland, WA 99352
Estimated Value: $542,000 - $637,000
3
Beds
2
Baths
2,776
Sq Ft
$211/Sq Ft
Est. Value
About This Home
This home is located at 1847 Newhaven Loop Unit Unbeatable Price in, Richland, WA 99352 and is currently estimated at $587,114, approximately $211 per square foot. 1847 Newhaven Loop Unit Unbeatable Price in is a home located in Benton County with nearby schools including Orchard Elementary School, Carmichael Middle School, and Richland High School.
Ownership History
Date
Name
Owned For
Owner Type
Purchase Details
Closed on
Jul 26, 2017
Sold by
Robinson Anthony and Robinson Teresa
Bought by
Schovajsa Daniel and Schovajsa Jessica
Current Estimated Value
Home Financials for this Owner
Home Financials are based on the most recent Mortgage that was taken out on this home.
Original Mortgage
$280,489
Outstanding Balance
$237,373
Interest Rate
4.5%
Mortgage Type
FHA
Estimated Equity
$349,741
Purchase Details
Closed on
Oct 17, 2008
Sold by
Richardson John E and Richardson Susan E
Bought by
Robinson Anthony and Robinson Teresa
Home Financials for this Owner
Home Financials are based on the most recent Mortgage that was taken out on this home.
Original Mortgage
$215,200
Interest Rate
5.9%
Mortgage Type
Purchase Money Mortgage
Create a Home Valuation Report for This Property
The Home Valuation Report is an in-depth analysis detailing your home's value as well as a comparison with similar homes in the area
Home Values in the Area
Average Home Value in this Area
Purchase History
| Date | Buyer | Sale Price | Title Company |
|---|---|---|---|
| Schovajsa Daniel | $383,921 | Fidelity Natl Title Co Of Wa | |
| Robinson Anthony | $269,000 | Chicago Title |
Source: Public Records
Mortgage History
| Date | Status | Borrower | Loan Amount |
|---|---|---|---|
| Open | Schovajsa Daniel | $280,489 | |
| Previous Owner | Robinson Anthony | $215,200 |
Source: Public Records
Tax History Compared to Growth
Tax History
| Year | Tax Paid | Tax Assessment Tax Assessment Total Assessment is a certain percentage of the fair market value that is determined by local assessors to be the total taxable value of land and additions on the property. | Land | Improvement |
|---|---|---|---|---|
| 2024 | $4,314 | $498,230 | $95,000 | $403,230 |
| 2023 | $4,314 | $461,580 | $95,000 | $366,580 |
| 2022 | $4,361 | $423,380 | $65,000 | $358,380 |
| 2021 | $3,992 | $394,320 | $65,000 | $329,320 |
| 2020 | $3,985 | $345,890 | $65,000 | $280,890 |
| 2019 | $3,487 | $326,520 | $65,000 | $261,520 |
| 2018 | $3,512 | $307,150 | $65,000 | $242,150 |
| 2017 | $2,959 | $258,720 | $65,000 | $193,720 |
| 2016 | $3,355 | $247,000 | $48,000 | $199,000 |
| 2015 | $3,400 | $247,000 | $48,000 | $199,000 |
| 2014 | -- | $247,000 | $48,000 | $199,000 |
| 2013 | -- | $247,000 | $48,000 | $199,000 |
Source: Public Records
Map
Nearby Homes
- 183 Mcintosh Ct
- 1924 Mint Loop
- 2172 Newhaven Loop
- 1971 Sheridan Place
- 316 Soaring Hawk St
- 1983 Greenbrook Blvd
- 1 Keene Rd Unit Lot 1
- 2 Keene Rd Unit Lot 2
- 3 Keene Rd Unit Lot 3
- 200 High Meadows St
- 1942 Sky Meadow Ave
- 245 High Meadows St
- 425 Greenbrook Place
- 481 Clermont Dr
- 450 Greenbrook Place
- 303 Gage Blvd Unit 304
- 303 Gage Blvd
- 303 Gage Blvd Unit 209
- 303 Gage Blvd Unit 122
- 303 Gage Blvd Unit 207
- 1847 Newhaven Loop Unit Certified Pre-Owned
- 1847 Newhaven Loop
- 1841 Newhaven Loop
- 1853 Newhaven Loop
- 178 Newhaven Place
- 178 Newhaven Place
- 1835 Newhaven Loop
- 184 Newhaven Place
- 172 Newhaven Place
- 1832 Newhaven Loop
- 172 Newhaven Place
- 1850 Newhaven Loop
- 1838 Newhaven Loop
- 1844 Newhaven Loop
- 1826 Newhaven Loop
- 1829 Newhaven Loop
- 1900 Newhaven Loop
- 1820 Newhaven Loop
- 1907 Newhaven Loop
- 166 Newhaven Place