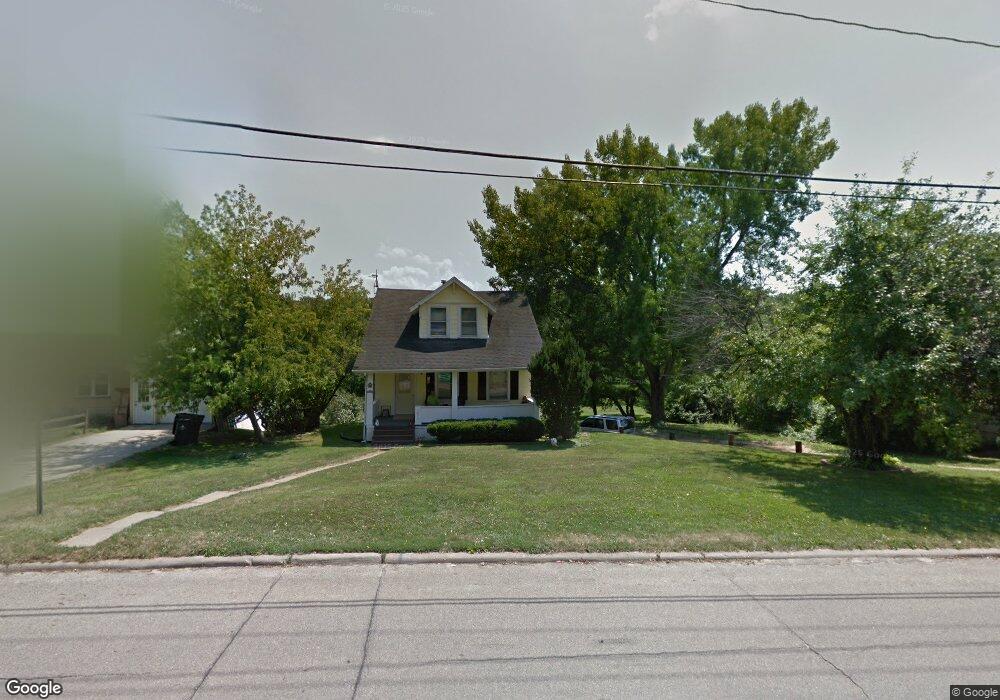
1847 O Ave NW Cedar Rapids, IA 52405
Estimated Value: $184,044 - $207,000
3
Beds
1
Bath
1,244
Sq Ft
$157/Sq Ft
Est. Value
About This Home
This home is located at 1847 O Ave NW, Cedar Rapids, IA 52405 and is currently estimated at $195,011, approximately $156 per square foot. 1847 O Ave NW is a home located in Linn County with nearby schools including Kentucky Tech - Ashland Reg Tech Center, Ponderosa Elementary School, and Madison Elementary School.
Ownership History
Date
Name
Owned For
Owner Type
Purchase Details
Closed on
Jul 31, 2012
Sold by
Scott Ernest H and Scott Penney J
Bought by
Four D Development Llc
Current Estimated Value
Purchase Details
Closed on
Jun 17, 2011
Sold by
Four D Development Llc
Bought by
Scott Ernest H and Scott Penney J
Home Financials for this Owner
Home Financials are based on the most recent Mortgage that was taken out on this home.
Original Mortgage
$118,000
Interest Rate
4.63%
Mortgage Type
Seller Take Back
Purchase Details
Closed on
Oct 13, 2006
Sold by
Madsen Joe A and Madsen Kimberly C
Bought by
Four D Development Llc
Home Financials for this Owner
Home Financials are based on the most recent Mortgage that was taken out on this home.
Original Mortgage
$119,114
Interest Rate
6.5%
Mortgage Type
Seller Take Back
Create a Home Valuation Report for This Property
The Home Valuation Report is an in-depth analysis detailing your home's value as well as a comparison with similar homes in the area
Home Values in the Area
Average Home Value in this Area
Purchase History
| Date | Buyer | Sale Price | Title Company |
|---|---|---|---|
| Four D Development Llc | -- | None Available | |
| Scott Ernest H | $120,000 | None Available | |
| Four D Development Llc | $118,500 | None Available | |
| Fisher Donald K | $118,990 | None Available |
Source: Public Records
Mortgage History
| Date | Status | Borrower | Loan Amount |
|---|---|---|---|
| Previous Owner | Scott Ernest H | $118,000 | |
| Previous Owner | Fisher Donald K | $119,114 | |
| Previous Owner | Four D Development Llc | $114,000 |
Source: Public Records
Tax History Compared to Growth
Tax History
| Year | Tax Paid | Tax Assessment Tax Assessment Total Assessment is a certain percentage of the fair market value that is determined by local assessors to be the total taxable value of land and additions on the property. | Land | Improvement |
|---|---|---|---|---|
| 2025 | $2,206 | $120,500 | $42,800 | $77,700 |
| 2024 | $2,226 | $124,700 | $42,800 | $81,900 |
| 2023 | $2,226 | $124,700 | $42,800 | $81,900 |
| 2022 | $2,376 | $105,500 | $42,600 | $62,900 |
| 2021 | $2,582 | $114,700 | $42,600 | $72,100 |
| 2020 | $2,582 | $117,000 | $42,600 | $74,400 |
| 2019 | $2,468 | $114,500 | $42,700 | $71,800 |
| 2018 | $2,400 | $114,500 | $42,700 | $71,800 |
| 2017 | $2,200 | $101,000 | $42,700 | $58,300 |
| 2016 | $1,998 | $94,000 | $42,700 | $51,300 |
| 2015 | $2,396 | $112,636 | $42,665 | $69,971 |
| 2014 | $2,396 | $112,636 | $42,665 | $69,971 |
| 2013 | $2,346 | $112,636 | $42,665 | $69,971 |
Source: Public Records
Map
Nearby Homes
- 0 O Ave NW
- 2210 O Ave NW
- 1724 O Ave NW
- 2520 N Ave NW
- 1424 N Ave NW
- 1814 Shawnee Ct NW
- 2801 Schultz Dr NW
- 949 Westwood Dr NW
- 2825 Schultz Dr NW
- 1130 13th St NW
- 1126 13th St NW
- 2048 20th St NW
- 1015 Pawnee Dr NW
- 2623 Iris Ave NW
- 1322 Woodside Dr NW
- 1860 E Ave NW
- 1733 Hillside Dr NW
- 2147 Sugar Creek Dr NW
- 2143 Sugar Creek Dr NW
- 820 M Ave NW
- 1841 O Ave NW
- 1865 O Ave NW
- 1837 O Ave NW
- 1607 20th St NW
- 1831 O Ave NW
- 1910 O Ave NW
- 2001 O Ave NW
- 1825 O Ave NW
- 1617 20th St NW
- 1838 O Ave NW
- 1600 20th St NW
- 1625 20th St NW
- 1817 O Ave NW
- 1816 O Ave NW
- 1606 20th St NW
- 2009 O Ave NW
- 1837 Garry Ave NW
- 1827 Garry Ave NW
- 1618 18th St NW
- 1612 20th St NW