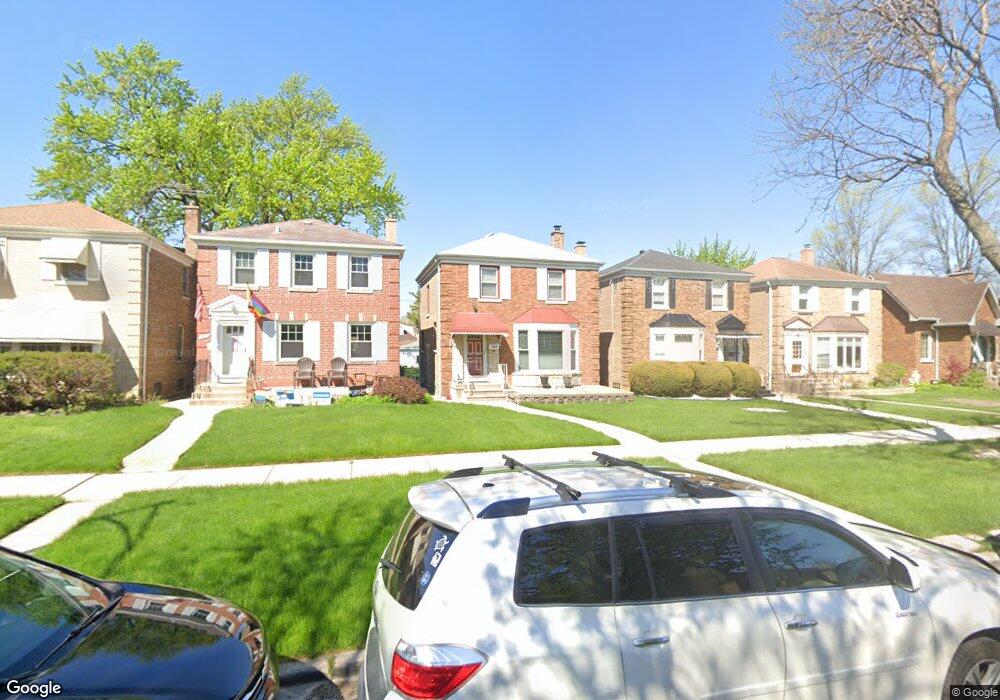
1848 N Nagle Ave Chicago, IL 60707
Galewood NeighborhoodEstimated Value: $326,000 - $397,000
3
Beds
2
Baths
1,273
Sq Ft
$288/Sq Ft
Est. Value
About This Home
This home is located at 1848 N Nagle Ave, Chicago, IL 60707 and is currently estimated at $366,509, approximately $287 per square foot. 1848 N Nagle Ave is a home located in Cook County with nearby schools including Lovett Elementary School, Steinmetz College Prep, and Acero - Roberto Clemente Elementary School.
Ownership History
Date
Name
Owned For
Owner Type
Purchase Details
Closed on
Oct 11, 2004
Sold by
React Financial
Bought by
Calvin James E and Lewis Calvin Rose M
Current Estimated Value
Home Financials for this Owner
Home Financials are based on the most recent Mortgage that was taken out on this home.
Original Mortgage
$223,120
Outstanding Balance
$108,495
Interest Rate
5.5%
Mortgage Type
Unknown
Estimated Equity
$258,014
Purchase Details
Closed on
Apr 14, 2004
Sold by
Mack Janiqua C
Bought by
React Financial
Purchase Details
Closed on
Nov 8, 2001
Sold by
Smith David and Smith Bonita P
Bought by
Mack Janiqua C
Home Financials for this Owner
Home Financials are based on the most recent Mortgage that was taken out on this home.
Original Mortgage
$156,000
Interest Rate
6.62%
Create a Home Valuation Report for This Property
The Home Valuation Report is an in-depth analysis detailing your home's value as well as a comparison with similar homes in the area
Home Values in the Area
Average Home Value in this Area
Purchase History
| Date | Buyer | Sale Price | Title Company |
|---|---|---|---|
| Calvin James E | $279,000 | Atgf Inc | |
| React Financial | -- | -- | |
| Mack Janiqua C | $195,000 | -- |
Source: Public Records
Mortgage History
| Date | Status | Borrower | Loan Amount |
|---|---|---|---|
| Open | Calvin James E | $223,120 | |
| Previous Owner | Mack Janiqua C | $156,000 | |
| Closed | Mack Janiqua C | $39,000 | |
| Closed | Calvin James E | $55,780 |
Source: Public Records
Tax History Compared to Growth
Tax History
| Year | Tax Paid | Tax Assessment Tax Assessment Total Assessment is a certain percentage of the fair market value that is determined by local assessors to be the total taxable value of land and additions on the property. | Land | Improvement |
|---|---|---|---|---|
| 2024 | $4,018 | $29,983 | $15,998 | $13,985 |
| 2023 | $3,878 | $25,000 | $12,633 | $12,367 |
| 2022 | $3,878 | $25,000 | $12,633 | $12,367 |
| 2021 | $3,824 | $24,998 | $12,631 | $12,367 |
| 2020 | $3,971 | $23,399 | $6,473 | $16,926 |
| 2019 | $4,045 | $26,292 | $6,473 | $19,819 |
| 2018 | $4,518 | $26,292 | $6,473 | $19,819 |
| 2017 | $3,878 | $21,379 | $5,696 | $15,683 |
| 2016 | $3,784 | $21,379 | $5,696 | $15,683 |
| 2015 | $3,439 | $21,379 | $5,696 | $15,683 |
| 2014 | $3,164 | $19,607 | $5,179 | $14,428 |
| 2013 | $3,090 | $19,607 | $5,179 | $14,428 |
Source: Public Records
Map
Nearby Homes
- 1627 N Narragansett Ave
- 1700 N Natoma Ave
- 1937 N Normandy Ave
- 1639 N Normandy Ave
- 1221 Edmer Ave
- 1733 N Oak Park Ave
- 1227 N East Ave
- 1212 N Harvey Ave
- 1122 N Ridgeland Ave
- 1715 N Meade Ave
- 1221 Hayes Ave
- 1104 Fair Oaks Ave
- 1701 N Newland Ave
- 1618 N Mcvicker Ave
- 2311 N Natchez Ave
- 102 Le Moyne Pkwy
- 1600 N New England Ave Unit 4
- 1625 N Mcvicker Ave
- 34 Le Moyne Pkwy
- 1657 N Austin Ave
- 1850 N Nagle Ave
- 1844 N Nagle Ave
- 1854 N Nagle Ave
- 1842 N Nagle Ave
- 1858 N Nagle Ave
- 1838 N Nagle Ave
- 1836 N Nagle Ave
- 1832 N Nagle Ave
- 1830 N Nagle Ave
- 1849 N Natchez Ave
- 1845 N Natchez Ave
- 1851 N Natchez Ave
- 1843 N Natchez Ave
- 1855 N Natchez Ave
- 1826 N Nagle Ave
- 1839 N Natchez Ave
- 1857 N Natchez Ave
- 1837 N Natchez Ave
- 1824 N Nagle Ave
- 1833 N Natchez Ave