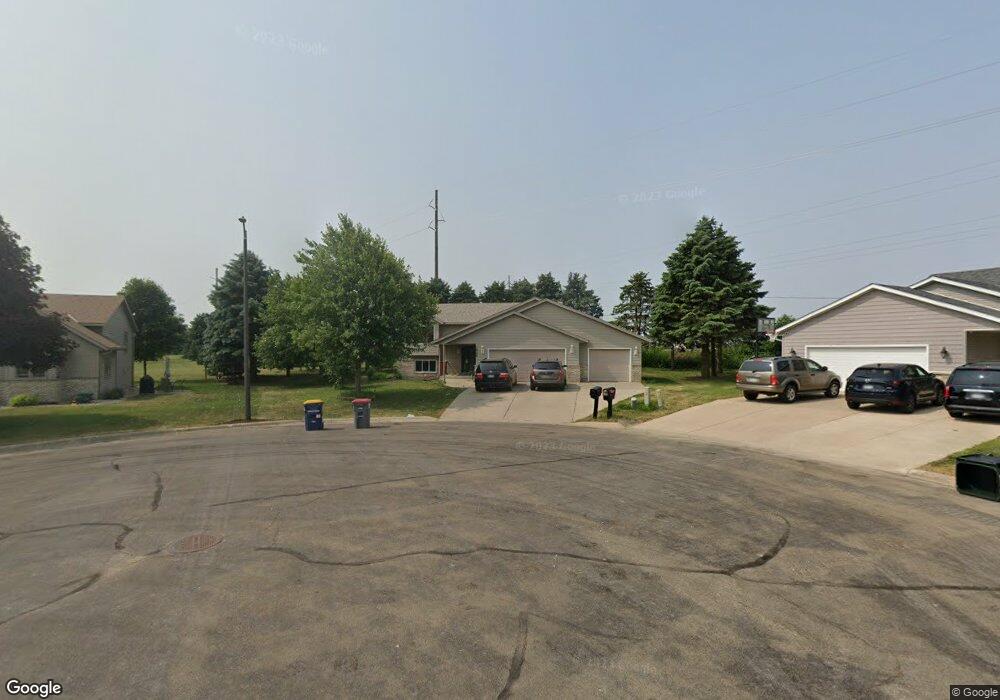
1848 Patricks Bay Faribault, MN 55021
Estimated Value: $340,000 - $358,000
4
Beds
2
Baths
2,225
Sq Ft
$157/Sq Ft
Est. Value
About This Home
This home is located at 1848 Patricks Bay, Faribault, MN 55021 and is currently estimated at $350,180, approximately $157 per square foot. 1848 Patricks Bay is a home located in Rice County with nearby schools including Jefferson Elementary School, Faribault Middle School, and Faribault Senior High School.
Ownership History
Date
Name
Owned For
Owner Type
Purchase Details
Closed on
Dec 1, 2020
Sold by
Vien Lien and Mai Thanh D
Bought by
Hassan Ahmed and Daoud Amina
Current Estimated Value
Home Financials for this Owner
Home Financials are based on the most recent Mortgage that was taken out on this home.
Original Mortgage
$223,920
Outstanding Balance
$199,711
Interest Rate
2.8%
Mortgage Type
New Conventional
Estimated Equity
$150,469
Purchase Details
Closed on
Jun 26, 2015
Sold by
Nagel Nicolas Nicolas
Bought by
Mai Thanh Thanh
Home Financials for this Owner
Home Financials are based on the most recent Mortgage that was taken out on this home.
Original Mortgage
$161,600
Interest Rate
4.02%
Purchase Details
Closed on
Mar 25, 2008
Sold by
Petersen Robert P and Petersen Carrie L
Bought by
Nagel Nicholas and Freman Angela
Purchase Details
Closed on
May 29, 1997
Sold by
Farmer Timothy S and Farmer Tonya J D
Bought by
Petersen Robert Paul
Create a Home Valuation Report for This Property
The Home Valuation Report is an in-depth analysis detailing your home's value as well as a comparison with similar homes in the area
Home Values in the Area
Average Home Value in this Area
Purchase History
| Date | Buyer | Sale Price | Title Company |
|---|---|---|---|
| Hassan Ahmed | $279,900 | Trademark Title Services Inc | |
| Mai Thanh Thanh | $206,600 | -- | |
| Nagel Nicholas | $220,000 | -- | |
| Petersen Robert Paul | $135,900 | -- | |
| Hassan Ahmed Ahmed | $279,900 | -- |
Source: Public Records
Mortgage History
| Date | Status | Borrower | Loan Amount |
|---|---|---|---|
| Open | Hassan Ahmed | $223,920 | |
| Previous Owner | Mai Thanh Thanh | $161,600 | |
| Closed | Hassan Ahmed Ahmed | $223,920 |
Source: Public Records
Tax History
| Year | Tax Paid | Tax Assessment Tax Assessment Total Assessment is a certain percentage of the fair market value that is determined by local assessors to be the total taxable value of land and additions on the property. | Land | Improvement |
|---|---|---|---|---|
| 2025 | $3,772 | $336,300 | $75,600 | $260,700 |
| 2024 | $3,772 | $305,300 | $69,100 | $236,200 |
| 2023 | $3,418 | $305,300 | $69,100 | $236,200 |
| 2022 | $3,014 | $289,200 | $69,100 | $220,100 |
| 2021 | $2,868 | $243,000 | $56,100 | $186,900 |
| 2020 | $2,690 | $231,400 | $49,700 | $181,700 |
| 2019 | $2,518 | $222,300 | $48,500 | $173,800 |
| 2018 | $2,616 | $207,500 | $44,100 | $163,400 |
| 2017 | $2,520 | $209,600 | $47,600 | $162,000 |
| 2016 | $2,608 | $197,300 | $45,100 | $152,200 |
| 2015 | $2,368 | $191,500 | $45,100 | $146,400 |
| 2014 | -- | $191,300 | $45,100 | $146,200 |
Source: Public Records
Map
Nearby Homes
- 1844 Patricks Bay
- 1705 Vale Ct
- 28 Mitchell Dr
- 1221 Home Place
- 1032 Valley View Rd
- 1124 8th Ave SW
- 1285 Cuylle Bay
- 1225 Cuylle Bay
- 1465 S Trail Cir
- Lots XXX of Divine Mercy
- 1406 Albers Path
- 1448 Glynview Trail
- 412 Prairie Ave SW
- 945 Rice St
- 941 Rice St
- 314 8th Ave SW
- 716 1st St NW
- 4 5th Ave NW
- 531 2nd St NW
- 521 2nd St NW
- 1844 Patricks
- 1852 Patricks Bay
- 1840 Patricks Bay
- 1856 Patricks Bay
- 1841 Patricks Bay
- 1836 Patricks Bay
- 1860 Patricks Bay
- 1810 Westwood Dr
- 1806 Westwood Dr
- 1833 Patricks Bay
- 1758 Patricks Bay
- 1802 Westwood Dr
- 1328 19th St SW
- 2000 Westwood Dr
- 1903 Westwood Dr
- 1759 Patricks Bay
- 1811 Westwood Dr
- 2004 Westwood Dr
- 1728 Westwood Dr
- 1807 Westwood Dr