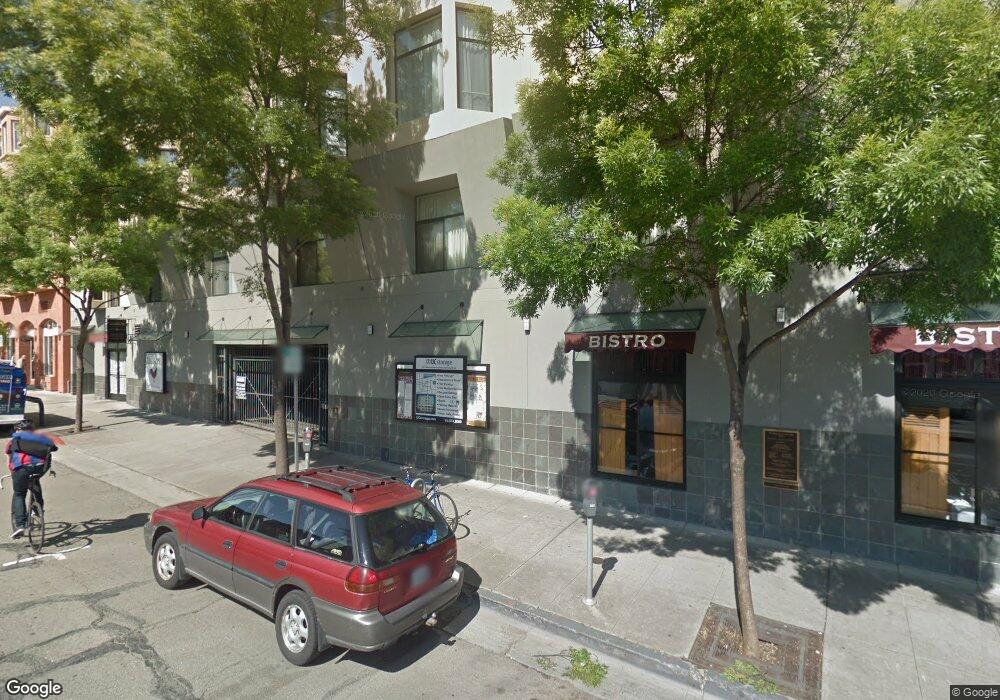
1849 Shattuck Ave Unit 205 Berkeley, CA 94709
North Berkeley NeighborhoodEstimated Value: $356,107 - $765,000
1
Bed
1
Bath
534
Sq Ft
$1,038/Sq Ft
Est. Value
About This Home
This home is located at 1849 Shattuck Ave Unit 205, Berkeley, CA 94709 and is currently estimated at $554,277, approximately $1,037 per square foot. 1849 Shattuck Ave Unit 205 is a home located in Alameda County with nearby schools including Berkeley Arts Magnet at Whittier School, Washington Elementary School, and Oxford Elementary School.
Ownership History
Date
Name
Owned For
Owner Type
Purchase Details
Closed on
Sep 18, 2015
Sold by
Sweeney Zephyr
Bought by
Sweeney Zephyr R and Sweeney Dennis A
Current Estimated Value
Home Financials for this Owner
Home Financials are based on the most recent Mortgage that was taken out on this home.
Original Mortgage
$140,000
Outstanding Balance
$109,923
Interest Rate
3.9%
Mortgage Type
New Conventional
Estimated Equity
$444,354
Purchase Details
Closed on
Oct 21, 2013
Sold by
Sweeney Zephyr
Bought by
Sweeney Zephyr
Purchase Details
Closed on
Jun 2, 2009
Sold by
Marderhorn Ora L
Bought by
Marderhorn Ora L
Purchase Details
Closed on
Feb 20, 1996
Sold by
Kennedy Patrick C
Bought by
Marderhorn Ora L
Home Financials for this Owner
Home Financials are based on the most recent Mortgage that was taken out on this home.
Original Mortgage
$65,440
Interest Rate
7.5%
Mortgage Type
Purchase Money Mortgage
Create a Home Valuation Report for This Property
The Home Valuation Report is an in-depth analysis detailing your home's value as well as a comparison with similar homes in the area
Home Values in the Area
Average Home Value in this Area
Purchase History
| Date | Buyer | Sale Price | Title Company |
|---|---|---|---|
| Sweeney Zephyr R | -- | Chicago Title Company | |
| Sweeney Zephyr | -- | None Available | |
| Marderhorn Ora L | -- | None Available | |
| Marderhorn Ora L | $82,000 | Old Republic Title Company |
Source: Public Records
Mortgage History
| Date | Status | Borrower | Loan Amount |
|---|---|---|---|
| Open | Sweeney Zephyr R | $140,000 | |
| Closed | Marderhorn Ora L | $65,440 | |
| Closed | Marderhorn Ora L | $15,000 |
Source: Public Records
Tax History Compared to Growth
Tax History
| Year | Tax Paid | Tax Assessment Tax Assessment Total Assessment is a certain percentage of the fair market value that is determined by local assessors to be the total taxable value of land and additions on the property. | Land | Improvement |
|---|---|---|---|---|
| 2025 | $3,406 | $152,000 | $36,774 | $115,226 |
| 2024 | $3,406 | $149,020 | $36,053 | $112,967 |
| 2023 | $3,321 | $146,098 | $35,346 | $110,752 |
| 2022 | $3,239 | $143,234 | $34,653 | $108,581 |
| 2021 | $3,227 | $140,427 | $33,974 | $106,453 |
| 2020 | $3,021 | $138,987 | $33,626 | $105,361 |
| 2019 | $2,862 | $136,263 | $32,967 | $103,296 |
| 2018 | $2,803 | $133,591 | $32,320 | $101,271 |
| 2017 | $2,680 | $130,973 | $31,687 | $99,286 |
| 2016 | $2,558 | $128,404 | $31,065 | $97,339 |
| 2015 | $2,512 | $126,477 | $30,599 | $95,878 |
| 2014 | $2,483 | $300,000 | $90,000 | $210,000 |
Source: Public Records
Map
Nearby Homes
- 2117 Delaware St Unit B
- 1682 Oxford St
- 1906 Bonita Ave
- 2201 Virginia St Unit 2
- 2201 Virginia St Unit 3
- 1642 Milvia St Unit 2
- 1609 Bonita Ave Unit 3
- 1609 Bonita Ave Unit 5
- 1668 Arch St
- 1512 Walnut St
- 2451 Le Conte Ave
- 1444 Walnut St
- 2477 Virginia St
- 2218 -2222 Grant St
- 1700 Le Roy Ave
- 2517 Cedar St
- 2411 Durant Ave
- 2419 Durant Ave
- 2634 Virginia St Unit 13
- 1929 California St
- 1849 Shattuck Ave Unit 408
- 1849 Shattuck Ave Unit 308
- 1849 Shattuck Ave Unit 208
- 1849 Shattuck Ave Unit 407
- 1849 Shattuck Ave Unit 307
- 1849 Shattuck Ave Unit 207
- 1849 Shattuck Ave Unit 301
- 1849 Shattuck Ave Unit 201
- 1849 Shattuck Ave Unit 406
- 1849 Shattuck Ave Unit 306
- 1849 Shattuck Ave Unit 206
- 1849 Shattuck Ave Unit 405
- 1849 Shattuck Ave Unit 305
- 1849 Shattuck Ave Unit 404
- 1849 Shattuck Ave Unit 304
- 1849 Shattuck Ave Unit 204
- 1849 Shattuck Ave Unit 403
- 1849 Shattuck Ave Unit 303
- 1849 Shattuck Ave Unit 203
- 1849 Shattuck Ave Unit 402