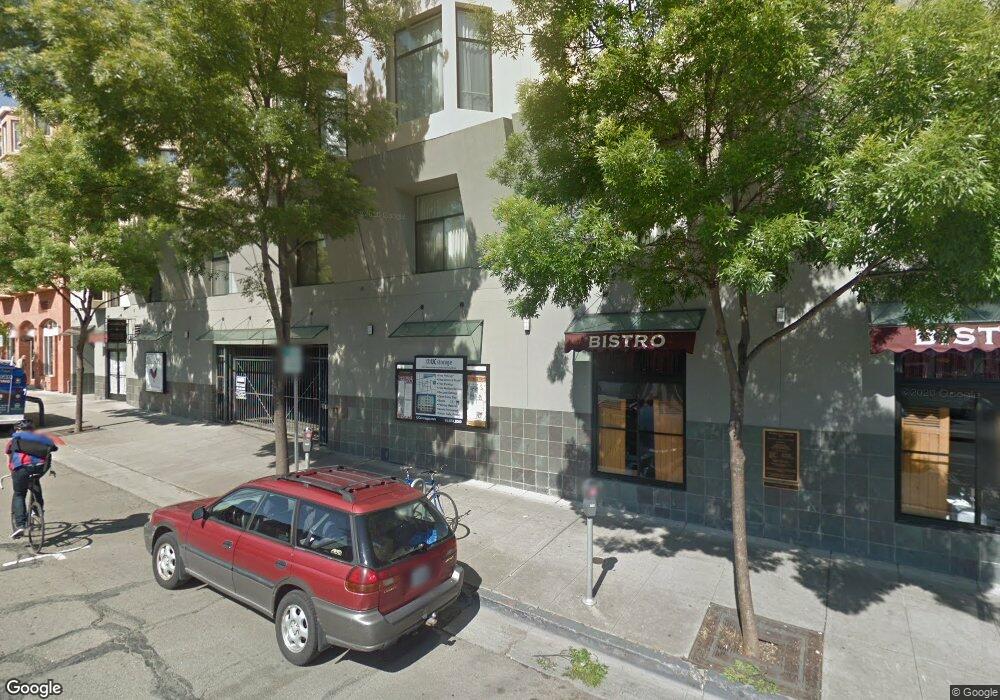
1849 Shattuck Ave Unit 403 Berkeley, CA 94709
North Berkeley NeighborhoodEstimated Value: $613,000 - $724,000
1
Bed
1
Bath
854
Sq Ft
$770/Sq Ft
Est. Value
About This Home
This home is located at 1849 Shattuck Ave Unit 403, Berkeley, CA 94709 and is currently estimated at $657,196, approximately $769 per square foot. 1849 Shattuck Ave Unit 403 is a home located in Alameda County with nearby schools including Berkeley Arts Magnet at Whittier School, Washington Elementary School, and Oxford Elementary School.
Ownership History
Date
Name
Owned For
Owner Type
Purchase Details
Closed on
Jul 26, 2019
Sold by
Dang Dennis
Bought by
Dang Dennis Hm
Current Estimated Value
Purchase Details
Closed on
Sep 24, 2018
Sold by
Leung Steven and Leung Phoebe
Bought by
Dang Dennis
Purchase Details
Closed on
Sep 5, 2016
Sold by
Leung Steven T and Leung Phoebe
Bought by
Leung Steven and Leung Phoebe
Purchase Details
Closed on
Nov 8, 2004
Sold by
Gallagher J Tim
Bought by
Leung Steven T and Leung Phoebe
Home Financials for this Owner
Home Financials are based on the most recent Mortgage that was taken out on this home.
Original Mortgage
$319,200
Interest Rate
5.7%
Mortgage Type
Purchase Money Mortgage
Purchase Details
Closed on
Apr 29, 1996
Sold by
Kennedy Patrick C
Bought by
Gallagher J Tim
Home Financials for this Owner
Home Financials are based on the most recent Mortgage that was taken out on this home.
Original Mortgage
$160,000
Interest Rate
7.84%
Mortgage Type
Balloon
Create a Home Valuation Report for This Property
The Home Valuation Report is an in-depth analysis detailing your home's value as well as a comparison with similar homes in the area
Home Values in the Area
Average Home Value in this Area
Purchase History
| Date | Buyer | Sale Price | Title Company |
|---|---|---|---|
| Dang Dennis Hm | -- | None Available | |
| Dang Dennis | $605,000 | Chicago Title Company | |
| Leung Steven | -- | None Available | |
| Leung Steven T | $399,000 | Placer Title Company | |
| Gallagher J Tim | $200,000 | Old Republic Title Company |
Source: Public Records
Mortgage History
| Date | Status | Borrower | Loan Amount |
|---|---|---|---|
| Previous Owner | Leung Steven T | $319,200 | |
| Previous Owner | Gallagher J Tim | $160,000 |
Source: Public Records
Tax History
| Year | Tax Paid | Tax Assessment Tax Assessment Total Assessment is a certain percentage of the fair market value that is determined by local assessors to be the total taxable value of land and additions on the property. | Land | Improvement |
|---|---|---|---|---|
| 2025 | $9,575 | $674,877 | $202,463 | $472,414 |
| 2024 | $9,575 | $661,645 | $198,493 | $463,152 |
| 2023 | $9,298 | $648,674 | $194,602 | $454,072 |
| 2022 | $9,151 | $628,957 | $190,787 | $445,170 |
| 2021 | $9,181 | $616,488 | $187,046 | $436,442 |
| 2020 | $8,759 | $617,100 | $185,130 | $431,970 |
| 2019 | $8,488 | $605,000 | $181,500 | $423,500 |
| 2018 | $7,164 | $488,770 | $146,631 | $342,139 |
| 2017 | $6,906 | $479,190 | $143,757 | $335,433 |
| 2016 | $6,712 | $469,797 | $140,939 | $328,858 |
| 2015 | $6,621 | $462,743 | $138,823 | $323,920 |
| 2014 | $6,042 | $410,000 | $123,000 | $287,000 |
Source: Public Records
Map
Nearby Homes
- 2015 Delaware St
- 2015 Delaware St Unit A
- 2201 Virginia St Unit 2
- 1610 Milvia St
- 1609 Bonita Ave Unit 3
- 1609 Bonita Ave Unit 5
- 2340 Virginia St
- 2451 Le Conte Ave
- 1444 Walnut St
- 2218 -2222 Grant St
- 1440 Walnut St Unit 5
- 1425 Martin Luther King jr Way
- 2012 Rose St
- 1471 Scenic Ave
- 2600 Hilgard Ave
- 2634 Virginia St Unit 13
- 2700 Le Conte Ave Unit 301
- 2700 Le Conte Ave Unit 402
- 2118 California St
- 1512 Hearst Ave Unit 1512
- 1849 Shattuck Ave Unit 408
- 1849 Shattuck Ave Unit 308
- 1849 Shattuck Ave Unit 208
- 1849 Shattuck Ave Unit 407
- 1849 Shattuck Ave Unit 307
- 1849 Shattuck Ave Unit 207
- 1849 Shattuck Ave Unit 301
- 1849 Shattuck Ave Unit 201
- 1849 Shattuck Ave Unit 406
- 1849 Shattuck Ave Unit 306
- 1849 Shattuck Ave Unit 206
- 1849 Shattuck Ave Unit 405
- 1849 Shattuck Ave Unit 305
- 1849 Shattuck Ave Unit 205
- 1849 Shattuck Ave Unit 404
- 1849 Shattuck Ave Unit 304
- 1849 Shattuck Ave Unit 204
- 1849 Shattuck Ave Unit 303
- 1849 Shattuck Ave Unit 203
- 1849 Shattuck Ave Unit 402
Your Personal Tour Guide
Ask me questions while you tour the home.