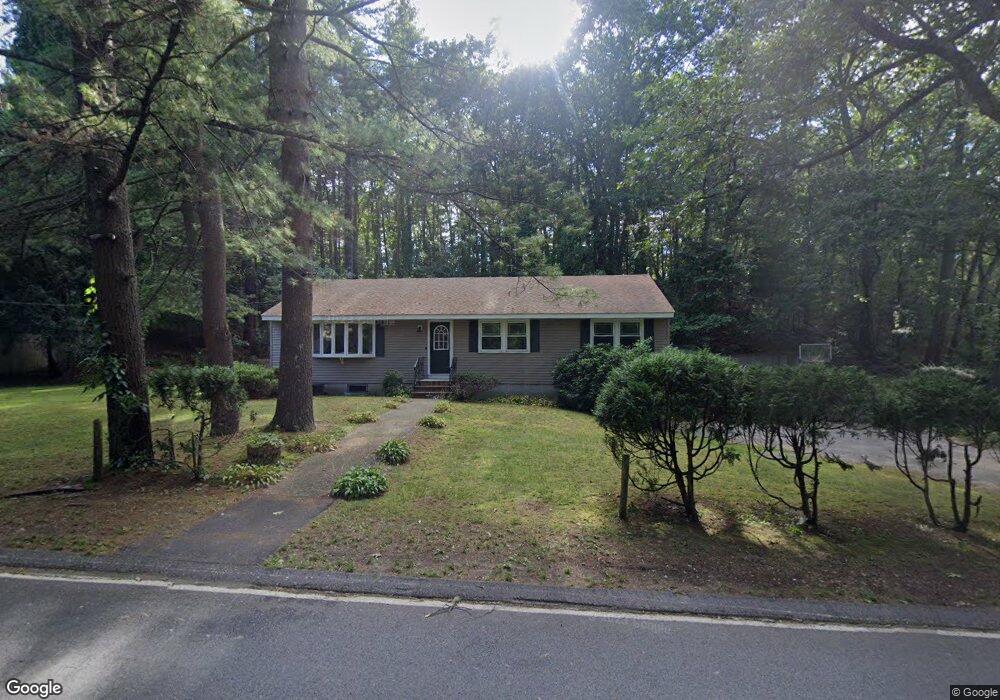
185 Abbot St Andover, MA 01810
Southern Andover NeighborhoodEstimated Value: $755,000 - $930,000
3
Beds
3
Baths
1,456
Sq Ft
$563/Sq Ft
Est. Value
About This Home
This home is located at 185 Abbot St, Andover, MA 01810 and is currently estimated at $819,432, approximately $562 per square foot. 185 Abbot St is a home located in Essex County with nearby schools including South Elementary School, Doherty Middle School, and Andover High School.
Ownership History
Date
Name
Owned For
Owner Type
Purchase Details
Closed on
Nov 29, 2006
Sold by
Foohey Richard T and Foohey Tracy E
Bought by
Elhbeck Patricia L
Current Estimated Value
Purchase Details
Closed on
Apr 1, 2004
Sold by
Stewart Edward M and Stewart Saundra T
Bought by
Foohey Richard T and Foohey Tracy E
Home Financials for this Owner
Home Financials are based on the most recent Mortgage that was taken out on this home.
Original Mortgage
$362,475
Interest Rate
5.56%
Mortgage Type
Purchase Money Mortgage
Create a Home Valuation Report for This Property
The Home Valuation Report is an in-depth analysis detailing your home's value as well as a comparison with similar homes in the area
Home Values in the Area
Average Home Value in this Area
Purchase History
| Date | Buyer | Sale Price | Title Company |
|---|---|---|---|
| Elhbeck Patricia L | $400,000 | -- | |
| Elhbeck Patricia L | $400,000 | -- | |
| Foohey Richard T | $405,000 | -- | |
| Foohey Richard T | $405,000 | -- |
Source: Public Records
Mortgage History
| Date | Status | Borrower | Loan Amount |
|---|---|---|---|
| Previous Owner | Foohey Richard T | $362,475 | |
| Previous Owner | Foohey Richard T | $162,500 |
Source: Public Records
Tax History Compared to Growth
Tax History
| Year | Tax Paid | Tax Assessment Tax Assessment Total Assessment is a certain percentage of the fair market value that is determined by local assessors to be the total taxable value of land and additions on the property. | Land | Improvement |
|---|---|---|---|---|
| 2024 | $9,700 | $753,100 | $516,800 | $236,300 |
| 2023 | $9,287 | $679,900 | $465,500 | $214,400 |
| 2022 | $8,726 | $597,700 | $412,000 | $185,700 |
| 2021 | $8,350 | $546,100 | $374,500 | $171,600 |
| 2020 | $8,024 | $534,600 | $365,400 | $169,200 |
| 2019 | $7,733 | $506,400 | $351,200 | $155,200 |
| 2018 | $7,429 | $475,000 | $331,200 | $143,800 |
| 2017 | $7,110 | $468,400 | $324,700 | $143,700 |
| 2016 | $6,959 | $469,600 | $324,700 | $144,900 |
| 2015 | $6,734 | $449,800 | $312,300 | $137,500 |
Source: Public Records
Map
Nearby Homes