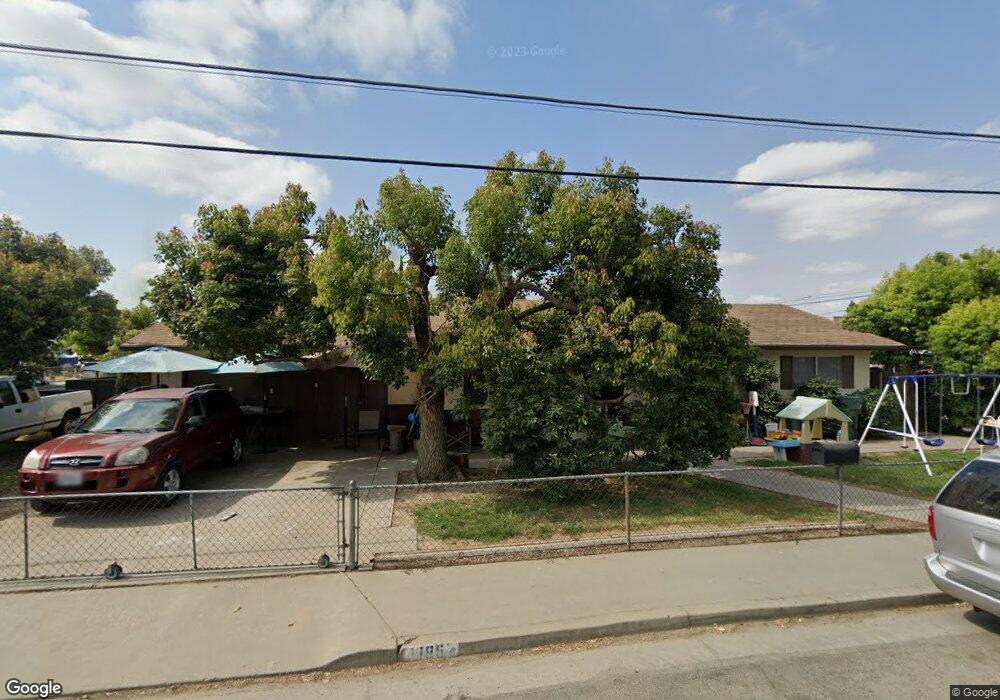
185 E Ash St Farmersville, CA 93223
Estimated Value: $266,000 - $282,000
3
Beds
3
Baths
1,012
Sq Ft
$270/Sq Ft
Est. Value
About This Home
This home is located at 185 E Ash St, Farmersville, CA 93223 and is currently estimated at $273,528, approximately $270 per square foot. 185 E Ash St is a home located in Tulare County with nearby schools including J.E. Hester Elementary School, George L. Snowden Elementary School, and Freedom Elementary School.
Ownership History
Date
Name
Owned For
Owner Type
Purchase Details
Closed on
Jul 6, 2021
Sold by
Kemp Gary L and Kersey Sandra R
Bought by
Kemp Gary L and Kersey Sandra R
Current Estimated Value
Purchase Details
Closed on
Oct 2, 2012
Sold by
Cooksey Connie Jeanette Kemp
Bought by
Kemp Bruce Imanuel
Purchase Details
Closed on
Apr 2, 2009
Sold by
Kemp Melvin
Bought by
Kemp Gerald and Kemp Bruce
Home Financials for this Owner
Home Financials are based on the most recent Mortgage that was taken out on this home.
Original Mortgage
$20,000
Outstanding Balance
$12,799
Interest Rate
5.17%
Mortgage Type
Purchase Money Mortgage
Estimated Equity
$260,729
Purchase Details
Closed on
Aug 28, 2008
Sold by
Kemp Gerald A
Bought by
Kemp Gary L and Kersey Sandra R
Purchase Details
Closed on
Sep 29, 1999
Sold by
Va
Bought by
Kemp Gerald A
Create a Home Valuation Report for This Property
The Home Valuation Report is an in-depth analysis detailing your home's value as well as a comparison with similar homes in the area
Home Values in the Area
Average Home Value in this Area
Purchase History
| Date | Buyer | Sale Price | Title Company |
|---|---|---|---|
| Kemp Gary L | -- | None Available | |
| Kemp Bruce Imanuel | -- | Chicago Title Company | |
| Kemp Gerald | $20,000 | None Available | |
| Kemp Gary L | -- | None Available | |
| Kemp Gerald A | -- | -- |
Source: Public Records
Mortgage History
| Date | Status | Borrower | Loan Amount |
|---|---|---|---|
| Open | Kemp Gerald | $20,000 |
Source: Public Records
Tax History Compared to Growth
Tax History
| Year | Tax Paid | Tax Assessment Tax Assessment Total Assessment is a certain percentage of the fair market value that is determined by local assessors to be the total taxable value of land and additions on the property. | Land | Improvement |
|---|---|---|---|---|
| 2025 | $839 | $82,969 | $25,378 | $57,591 |
| 2024 | $839 | $81,343 | $24,881 | $56,462 |
| 2023 | $840 | $79,749 | $24,394 | $55,355 |
| 2022 | $777 | $78,186 | $23,916 | $54,270 |
| 2021 | $760 | $76,653 | $23,447 | $53,206 |
| 2020 | $747 | $75,867 | $23,207 | $52,660 |
| 2019 | $759 | $74,379 | $22,752 | $51,627 |
| 2018 | $731 | $72,921 | $22,306 | $50,615 |
| 2017 | $743 | $71,492 | $21,869 | $49,623 |
| 2016 | $695 | $70,090 | $21,440 | $48,650 |
| 2015 | $662 | $69,037 | $21,118 | $47,919 |
| 2014 | $662 | $67,684 | $20,704 | $46,980 |
Source: Public Records
Map
Nearby Homes
- 701 Farmersville Rd
- 438 N Magnolia Ave
- 896 Farmersville Rd
- 0 S Farmersville Blvd Unit 238390
- 680 E Larry St
- 209 S Magnolia Ave
- 738 E Larry St
- 188 E Citrus Dr
- 322 E Citrus Dr
- 885 E Ash St
- 903 E Ash St
- 327 S Farmersville Blvd
- 732 N Dwight Ave
- 528 S Camelia Ave
- 245 W Oakland St
- 753 N Brundage Ave
- 896 N Mariposa Ave
- 1643 Tehama Ave
- 0 Avenue 288
- 0 Avenue 288
- 505 N Magnolia Ave
- 188 E Ash St
- 493 N Magnolia Ave
- 514 N Farmersville Blvd
- 581 N Magnolia Ave
- 473 N Magnolia Ave
- 554 N Farmersville Blvd
- 526 N Magnolia Ave
- 510 N Magnolia Ave
- 490 Farmersville Rd
- 448 N Farmersville Blvd
- 236 E Ash St
- 492 N Magnolia Ave
- 599 N Magnolia Ave
- 453 N Magnolia Ave
- 474 N Magnolia Ave
- 580 N Magnolia Ave
- 615 N Magnolia Ave
- 437 N Magnolia Ave
- 598 N Magnolia Ave