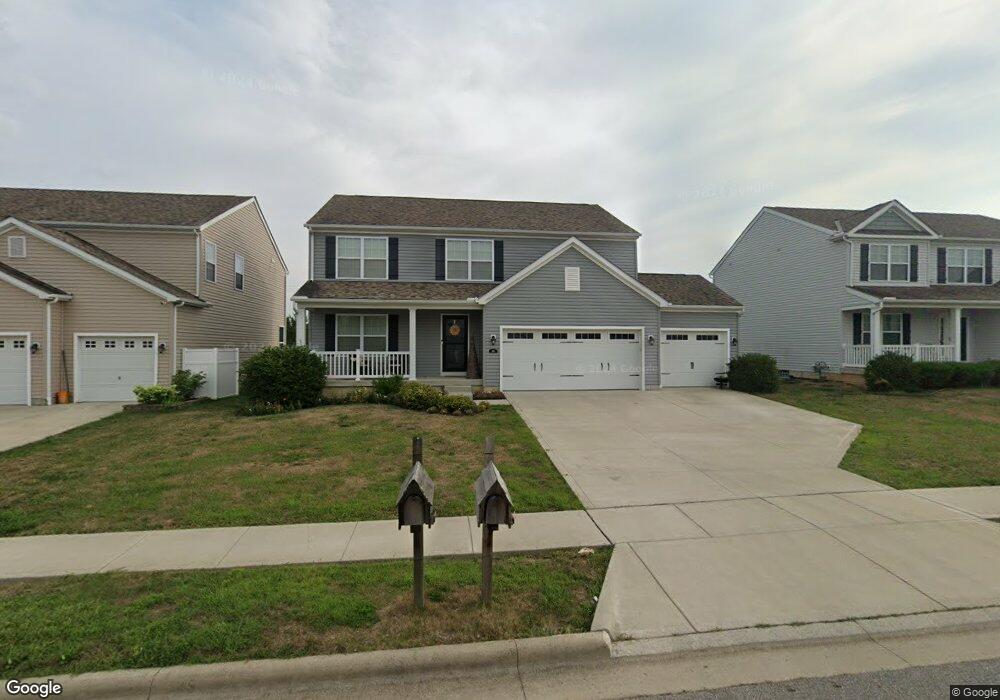
185 Honey Locust Ln Commercial Point, OH 43116
Estimated Value: $348,000 - $401,000
4
Beds
3
Baths
2,240
Sq Ft
$171/Sq Ft
Est. Value
About This Home
This home is located at 185 Honey Locust Ln, Commercial Point, OH 43116 and is currently estimated at $383,361, approximately $171 per square foot. 185 Honey Locust Ln is a home.
Ownership History
Date
Name
Owned For
Owner Type
Purchase Details
Closed on
Jan 20, 2021
Sold by
Jones Cheston C and Heiselman Jessica L
Bought by
Jones Cheston C and Jones Jessica L
Current Estimated Value
Home Financials for this Owner
Home Financials are based on the most recent Mortgage that was taken out on this home.
Original Mortgage
$217,000
Outstanding Balance
$186,275
Interest Rate
2.6%
Mortgage Type
New Conventional
Estimated Equity
$197,086
Purchase Details
Closed on
Nov 12, 2015
Sold by
Westport Homes Inc
Bought by
Jones Cheston C and Heiselman Jessica L
Home Financials for this Owner
Home Financials are based on the most recent Mortgage that was taken out on this home.
Original Mortgage
$220,030
Interest Rate
3.75%
Mortgage Type
FHA
Purchase Details
Closed on
Jun 11, 2015
Sold by
Saddlebrook Development Llc
Bought by
Westport Homes Inc
Home Financials for this Owner
Home Financials are based on the most recent Mortgage that was taken out on this home.
Original Mortgage
$50,000,000
Interest Rate
3.86%
Mortgage Type
Future Advance Clause Open End Mortgage
Create a Home Valuation Report for This Property
The Home Valuation Report is an in-depth analysis detailing your home's value as well as a comparison with similar homes in the area
Home Values in the Area
Average Home Value in this Area
Purchase History
| Date | Buyer | Sale Price | Title Company |
|---|---|---|---|
| Jones Cheston C | -- | Valmer Land Title Agency Box | |
| Jones Cheston C | -- | Valmer Land Title | |
| Jones Cheston C | $224,100 | Attorney | |
| Westport Homes Inc | $93,000 | Attorney |
Source: Public Records
Mortgage History
| Date | Status | Borrower | Loan Amount |
|---|---|---|---|
| Open | Jones Cheston C | $217,000 | |
| Closed | Jones Cheston C | $217,000 | |
| Previous Owner | Jones Cheston C | $220,030 | |
| Previous Owner | Westport Homes Inc | $50,000,000 |
Source: Public Records
Tax History Compared to Growth
Tax History
| Year | Tax Paid | Tax Assessment Tax Assessment Total Assessment is a certain percentage of the fair market value that is determined by local assessors to be the total taxable value of land and additions on the property. | Land | Improvement |
|---|---|---|---|---|
| 2024 | -- | $113,130 | $12,820 | $100,310 |
| 2023 | $4,255 | $113,130 | $12,820 | $100,310 |
| 2022 | $3,732 | $91,150 | $10,680 | $80,470 |
| 2021 | $3,743 | $91,150 | $10,680 | $80,470 |
| 2020 | $3,744 | $91,150 | $10,680 | $80,470 |
| 2019 | $3,080 | $72,840 | $10,680 | $62,160 |
| 2018 | $2,839 | $72,840 | $10,680 | $62,160 |
| 2017 | $3,828 | $72,840 | $10,680 | $62,160 |
| 2016 | $2,557 | $63,810 | $8,170 | $55,640 |
| 2015 | $269 | $6,530 | $6,530 | $0 |
| 2014 | $270 | $6,530 | $6,530 | $0 |
Source: Public Records
Map
Nearby Homes
- 182 Honey Locust Ln
- 11044 Coontz Rd
- 161 Chestnut Estates Dr
- 186 Red Oak Ct
- 169 Chestnut Commons Dr
- 166 Rosewood Loop SE
- 7789 State Route 762
- 56 Chambers Bay Rd
- 294 Shady Hollow Dr
- 47 Front St
- 66 Genoa Cir
- 62 Genoa Cir
- 55 Genoa Cir
- The Siebert Plan at Genoa Crossing
- The Hollandia B Plan at Genoa Crossing
- The Rainier Plan at Genoa Crossing
- The Petoskey Plan at Genoa Crossing
- 310 Genoa Rd
- 45 Genoa Cir
- 428 Lockbay Rd
- 188 Honey Locust Ln
- 183 Honey Locust Ln
- 186 Honey Locust Ln
- 187 Honey Locust Ln
- 190 Honey Locust Ln Unit 197
- 181 Honey Locust Ln
- 189 Honey Locust Ln
- 184 Honey Locust Ln
- 192 Honey Locust Ln
- 179 Honey Locust Ln Unit 174
- 191 Honey Locust Ln
- 194 Honey Locust Ln
- 161 Cottonwood Place
- 161 Cottonwood Place Unit 161
- 180 Honey Locust Ln
- 177 Honey Locust Ln
- 7361 State Route 762
- 193 Honey Locust Ln Unit 181
- 165 Cottonwood Place
- 157 Cottonwood Place