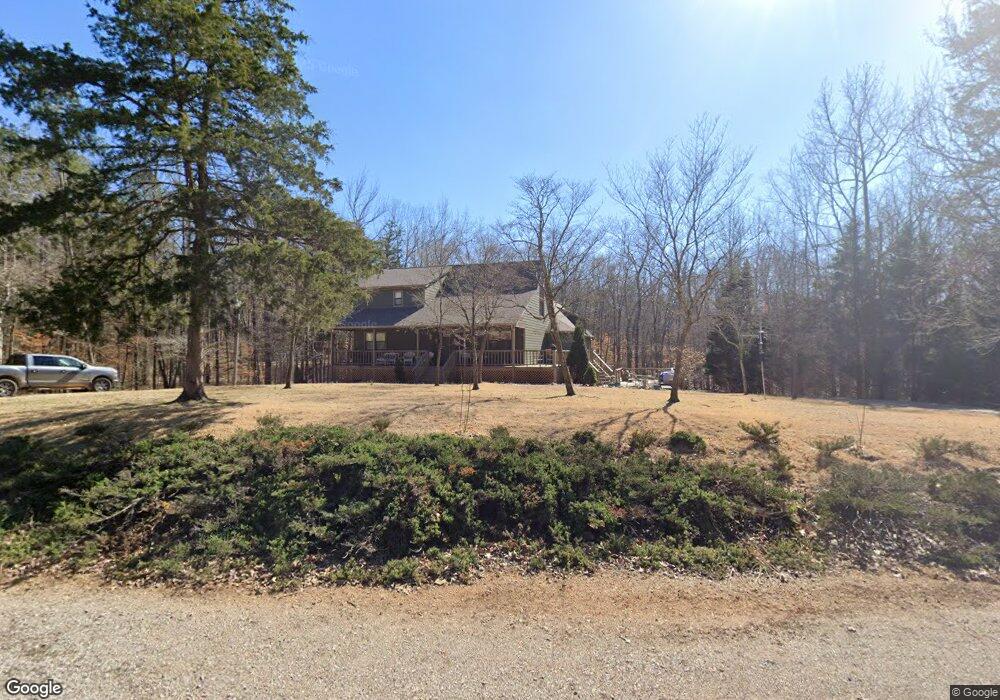
185 L Sealy Cove Counce, TN 38326
Estimated Value: $351,000 - $474,451
--
Bed
3
Baths
3,050
Sq Ft
$144/Sq Ft
Est. Value
About This Home
This home is located at 185 L Sealy Cove, Counce, TN 38326 and is currently estimated at $439,863, approximately $144 per square foot. 185 L Sealy Cove is a home located in Hardin County with nearby schools including Hardin County High School.
Ownership History
Date
Name
Owned For
Owner Type
Purchase Details
Closed on
Sep 23, 2003
Sold by
Pickwick Lake Builders Eta
Bought by
Dale Stover
Current Estimated Value
Home Financials for this Owner
Home Financials are based on the most recent Mortgage that was taken out on this home.
Original Mortgage
$83,400
Outstanding Balance
$32,341
Interest Rate
3.88%
Estimated Equity
$407,522
Purchase Details
Closed on
Apr 25, 2002
Sold by
Pickwick Lake Builders Eta
Bought by
Ilsley Frank A
Purchase Details
Closed on
Dec 1, 1992
Bought by
Bryson Creek Inc
Purchase Details
Closed on
Sep 4, 1992
Bought by
Grusin Martin A Escrow Agent
Purchase Details
Closed on
May 31, 1988
Bought by
Pickwick Properties Ltd
Purchase Details
Closed on
Apr 29, 1986
Bought by
Resorts Management & Marketing Inc
Create a Home Valuation Report for This Property
The Home Valuation Report is an in-depth analysis detailing your home's value as well as a comparison with similar homes in the area
Home Values in the Area
Average Home Value in this Area
Purchase History
| Date | Buyer | Sale Price | Title Company |
|---|---|---|---|
| Dale Stover | $99,275 | -- | |
| Ilsley Frank A | $132,000 | -- | |
| Bryson Creek Inc | -- | -- | |
| Grusin Martin A Escrow Agent | -- | -- | |
| Pickwick Properties Ltd | -- | -- | |
| Resorts Management & Marketing Inc | -- | -- |
Source: Public Records
Mortgage History
| Date | Status | Borrower | Loan Amount |
|---|---|---|---|
| Open | Resorts Management & Marketing Inc | $83,400 | |
| Closed | Resorts Management & Marketing Inc | $15,650 |
Source: Public Records
Tax History Compared to Growth
Tax History
| Year | Tax Paid | Tax Assessment Tax Assessment Total Assessment is a certain percentage of the fair market value that is determined by local assessors to be the total taxable value of land and additions on the property. | Land | Improvement |
|---|---|---|---|---|
| 2024 | $1,870 | $106,875 | $7,000 | $99,875 |
| 2023 | $1,870 | $106,875 | $7,000 | $99,875 |
| 2022 | $1,504 | $73,025 | $5,625 | $67,400 |
| 2021 | $1,504 | $73,025 | $5,625 | $67,400 |
| 2020 | $1,504 | $73,025 | $5,625 | $67,400 |
| 2019 | $1,504 | $73,025 | $5,625 | $67,400 |
| 2018 | $1,454 | $73,025 | $5,625 | $67,400 |
| 2017 | $1,308 | $62,875 | $5,625 | $57,250 |
| 2016 | $1,308 | $62,875 | $5,625 | $57,250 |
| 2015 | $1,144 | $62,875 | $5,625 | $57,250 |
| 2014 | $1,144 | $62,875 | $5,625 | $57,250 |
Source: Public Records
Map
Nearby Homes
- 160 Dolores Cove
- 140 Murray Ln
- 345 Mossy Branch Dr
- 230 Adley Way
- 100 Carefree Ln
- 82 Saint Andrew's Ct
- 265 Rock Quarry Way
- 42 Saint Andrew's Ct
- 180 Vantage Point
- 100 Vantage Point
- 128 Oak Hollow Cove
- 40 Vantage Point
- 100 Dunhill Ct
- 67 Dunhill Ct
- 31 Dunhill Ct
- 25 Dunhill Ct
- 0 Masters Ct Unit 10141688
- 310 Ping Hill Cove
- 375 Turkey Knob Ln
- 60 Masters Ct
- 215 L Sealy Cove
- 105 Jorlee Ln
- 245 L Sealy Cove
- 190 L Sealy Cove
- 170 L Sealy Cove
- 230 L Sealy Cove
- 65 Jorlee Ln
- 265 L Sealy Cove
- 811 Slate Rock Dr
- 855 Slate Rock Dr
- 260 L Sealy Cove
- 275 L Sealy Cove
- 875 Slate Rock Dr
- 1 Slate Rock Dr
- 3 Slate Rock Dr
- 36 Slate Rock Dr
- 2 Slate Rock Dr
- 32 Slate Rock Dr
- 31 Slate Rock Dr
- 30 Slate Rock Dr