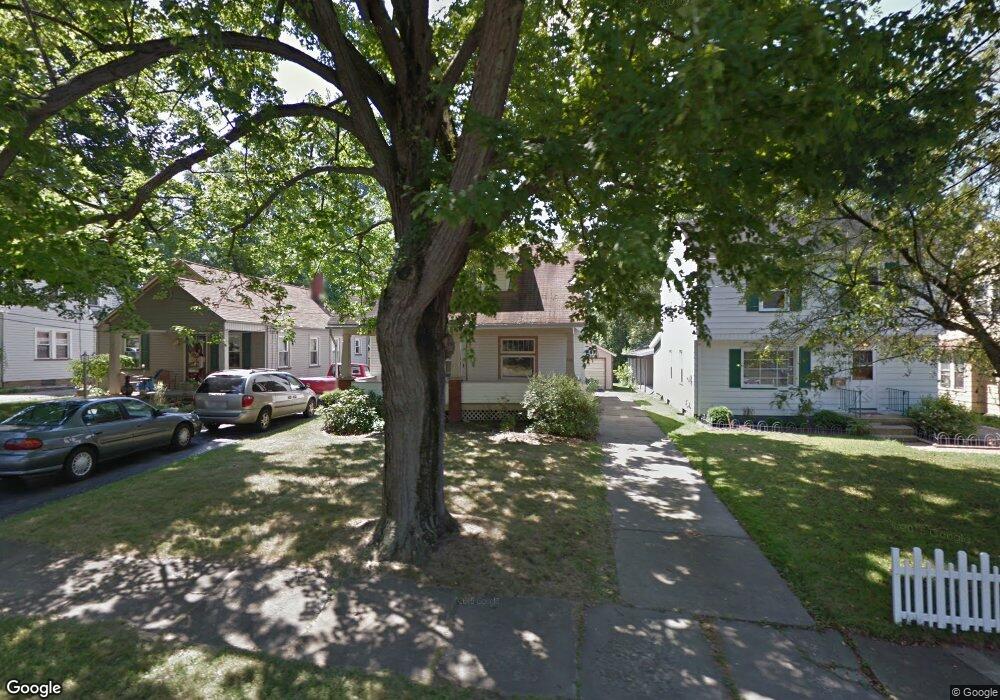
185 Maple Dr Youngstown, OH 44512
Estimated Value: $105,812 - $138,000
3
Beds
2
Baths
1,411
Sq Ft
$88/Sq Ft
Est. Value
About This Home
This home is located at 185 Maple Dr, Youngstown, OH 44512 and is currently estimated at $123,703, approximately $87 per square foot. 185 Maple Dr is a home located in Mahoning County with nearby schools including Boardman Glenwood Junior High School, Boardman High School, and Horizon Science Academy - Youngstown.
Ownership History
Date
Name
Owned For
Owner Type
Purchase Details
Closed on
Feb 17, 2006
Sold by
Mcquillan Jamell L and Mcquillan Timothy S
Bought by
Draia John C
Current Estimated Value
Home Financials for this Owner
Home Financials are based on the most recent Mortgage that was taken out on this home.
Original Mortgage
$16,400
Interest Rate
5.81%
Mortgage Type
Stand Alone Second
Purchase Details
Closed on
Jun 8, 2001
Sold by
Schroeder Scott R M
Bought by
Zarlengo Jamell L
Home Financials for this Owner
Home Financials are based on the most recent Mortgage that was taken out on this home.
Original Mortgage
$71,435
Interest Rate
7.16%
Mortgage Type
FHA
Purchase Details
Closed on
May 10, 1996
Sold by
Wade Craig J
Bought by
Schroder Scott R and Schroder Kristina M
Home Financials for this Owner
Home Financials are based on the most recent Mortgage that was taken out on this home.
Original Mortgage
$60,000
Interest Rate
7.78%
Mortgage Type
New Conventional
Purchase Details
Closed on
Jan 12, 1989
Bought by
Wade Wade C and Wade M
Create a Home Valuation Report for This Property
The Home Valuation Report is an in-depth analysis detailing your home's value as well as a comparison with similar homes in the area
Home Values in the Area
Average Home Value in this Area
Purchase History
| Date | Buyer | Sale Price | Title Company |
|---|---|---|---|
| Draia John C | $82,000 | Safeguard Title Agency | |
| Zarlengo Jamell L | $72,000 | -- | |
| Schroder Scott R | $60,000 | -- | |
| Wade Wade C | $24,500 | -- |
Source: Public Records
Mortgage History
| Date | Status | Borrower | Loan Amount |
|---|---|---|---|
| Closed | Draia John C | $16,400 | |
| Open | Draia John C | $65,600 | |
| Previous Owner | Zarlengo Jamell L | $71,435 | |
| Previous Owner | Schroder Scott R | $60,000 |
Source: Public Records
Tax History
| Year | Tax Paid | Tax Assessment Tax Assessment Total Assessment is a certain percentage of the fair market value that is determined by local assessors to be the total taxable value of land and additions on the property. | Land | Improvement |
|---|---|---|---|---|
| 2025 | $1,523 | $27,150 | $3,120 | $24,030 |
| 2024 | $1,409 | $27,150 | $3,120 | $24,030 |
| 2023 | $1,390 | $27,150 | $3,120 | $24,030 |
| 2022 | $875 | $12,780 | $3,020 | $9,760 |
| 2021 | $876 | $12,780 | $3,020 | $9,760 |
| 2020 | $880 | $12,780 | $3,020 | $9,760 |
| 2019 | $913 | $11,310 | $2,670 | $8,640 |
| 2018 | $817 | $11,310 | $2,670 | $8,640 |
| 2017 | $795 | $11,310 | $2,670 | $8,640 |
| 2016 | $1,260 | $19,500 | $3,190 | $16,310 |
| 2015 | $1,297 | $19,500 | $3,190 | $16,310 |
| 2014 | $1,239 | $19,500 | $3,190 | $16,310 |
| 2013 | $1,403 | $19,500 | $3,190 | $16,310 |
Source: Public Records
Map
Nearby Homes
- 189 Beechwood Dr
- 4441 Southern Blvd
- 4803 Southern Blvd Unit 805
- 196 Maywood Dr
- 86 Terrace Dr
- 63 Clifton Dr
- 4206 Rush Blvd
- 4127 Southern Blvd
- 192 Hollywood Ave
- 28 Terrace Dr
- 4144 Helena Ave
- 4717 Market St
- 173 Clarencedale Ave
- 4941 Market St
- 0 Indianola Rd
- 190 Melrose Ave
- 425 Tudor Ln
- 28 Jennette Dr
- 4038 Sunset Blvd
- 4629 Yarmouth Ln
Your Personal Tour Guide
Ask me questions while you tour the home.