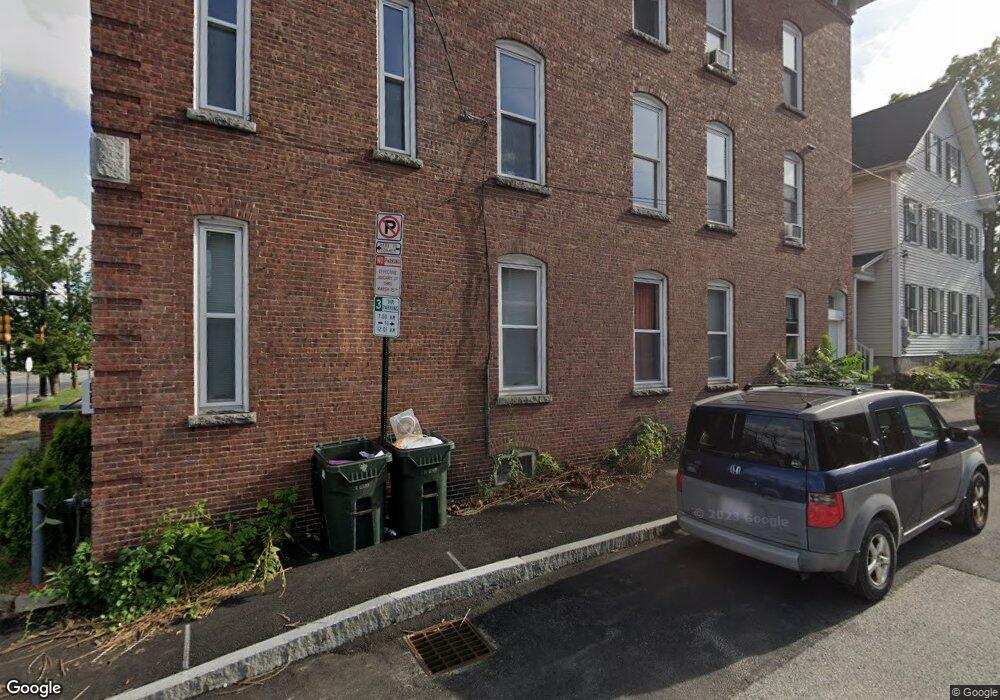
185 N Main St Concord, NH 03301
North End NeighborhoodEstimated Value: $703,653
2
Beds
1
Bath
1,664
Sq Ft
$423/Sq Ft
Est. Value
About This Home
This home is located at 185 N Main St, Concord, NH 03301 and is currently estimated at $703,653, approximately $422 per square foot. 185 N Main St is a home located in Merrimack County with nearby schools including Christa McAuliffe School, Rundlett Middle School, and Concord High School.
Ownership History
Date
Name
Owned For
Owner Type
Purchase Details
Closed on
Jul 8, 2005
Sold by
Robert K Mekell Llc and Martha K Mekell Llc
Bought by
Mills Ernest and Mills Lisa
Current Estimated Value
Home Financials for this Owner
Home Financials are based on the most recent Mortgage that was taken out on this home.
Original Mortgage
$273,000
Outstanding Balance
$54,304
Interest Rate
5.71%
Mortgage Type
Commercial
Estimated Equity
$649,349
Purchase Details
Closed on
Dec 27, 1996
Sold by
Wheeler Stanley L and Wheeler Shelley L
Bought by
Mekeel Llc Robert K and Mekeel Llc Martha K
Create a Home Valuation Report for This Property
The Home Valuation Report is an in-depth analysis detailing your home's value as well as a comparison with similar homes in the area
Home Values in the Area
Average Home Value in this Area
Purchase History
| Date | Buyer | Sale Price | Title Company |
|---|---|---|---|
| Mills Ernest | $364,000 | -- | |
| Mills Ernest | $364,000 | -- | |
| Mekeel Llc Robert K | $180,000 | -- | |
| Mekeel Llc Robert K | $180,000 | -- |
Source: Public Records
Mortgage History
| Date | Status | Borrower | Loan Amount |
|---|---|---|---|
| Open | Mills Ernest | $273,000 | |
| Closed | Mekeel Llc Robert K | $273,000 |
Source: Public Records
Tax History Compared to Growth
Tax History
| Year | Tax Paid | Tax Assessment Tax Assessment Total Assessment is a certain percentage of the fair market value that is determined by local assessors to be the total taxable value of land and additions on the property. | Land | Improvement |
|---|---|---|---|---|
| 2024 | $11,527 | $416,300 | $148,100 | $268,200 |
| 2023 | $11,182 | $416,300 | $148,100 | $268,200 |
| 2022 | $10,778 | $416,300 | $148,100 | $268,200 |
| 2021 | $10,457 | $416,300 | $148,100 | $268,200 |
| 2020 | $11,033 | $412,300 | $144,100 | $268,200 |
| 2019 | $11,454 | $412,300 | $144,100 | $268,200 |
| 2018 | $11,623 | $412,300 | $144,100 | $268,200 |
| 2017 | $11,643 | $412,300 | $144,100 | $268,200 |
| 2016 | $11,204 | $404,900 | $144,100 | $260,800 |
| 2015 | $11,070 | $404,900 | $144,100 | $260,800 |
| 2014 | $10,855 | $404,900 | $144,100 | $260,800 |
| 2013 | $10,357 | $404,900 | $144,100 | $260,800 |
| 2012 | $9,867 | $404,900 | $144,100 | $260,800 |
Source: Public Records
Map
Nearby Homes
- 5-7 Pearl St
- 189 N Main St
- 230 N Main St
- 230 N Main St Unit A
- 306 Whitney Brook Rd
- 181 N Main St
- 11 Pearl St Unit 13
- 10 Pearl St Unit 12
- 14 Pearl St
- 232 N Main St
- 15 Pearl St
- 197 N Main St
- 7 Washington St
- 5 Franklin St
- 5 Franklin St Unit 4
- 16 Pearl St
- 19 Pearl St
- 238 N Main St
- 20 Washington St
- 20 1/2 Washington St