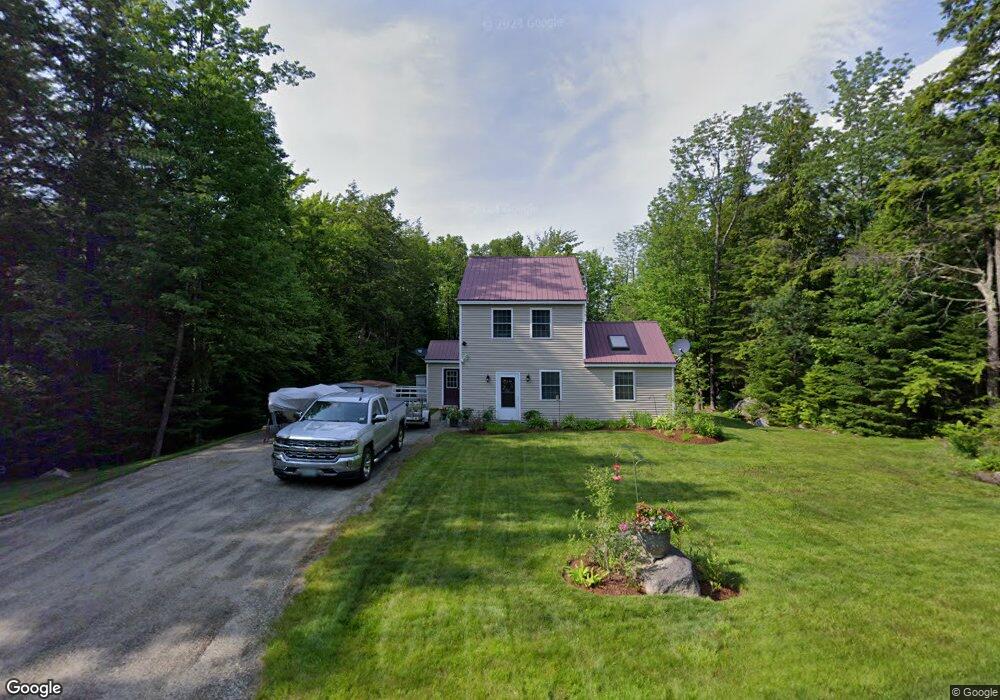
185 Noyes St Bethlehem, NH 03574
Estimated Value: $327,842 - $350,000
3
Beds
2
Baths
1,364
Sq Ft
$246/Sq Ft
Est. Value
About This Home
This home is located at 185 Noyes St, Bethlehem, NH 03574 and is currently estimated at $335,461, approximately $245 per square foot. 185 Noyes St is a home located in Grafton County with nearby schools including Bethlehem Elementary School, Profile Junior High School, and Profile Senior High School.
Ownership History
Date
Name
Owned For
Owner Type
Purchase Details
Closed on
Dec 7, 2021
Sold by
Goley Jeffrey P
Bought by
Jeffrey P Goley Ret and Goley
Current Estimated Value
Purchase Details
Closed on
Jun 22, 2016
Sold by
Goley Jeanne M
Bought by
Goley Jeffrey P
Purchase Details
Closed on
Feb 5, 2013
Sold by
Bethlehem Town Of
Bought by
Goley Jeffrey P and Goley Jeanne M
Purchase Details
Closed on
Apr 8, 2002
Sold by
Fallon Thomas E
Bought by
Goley Jeffrey P and Goley Jeanne M
Create a Home Valuation Report for This Property
The Home Valuation Report is an in-depth analysis detailing your home's value as well as a comparison with similar homes in the area
Home Values in the Area
Average Home Value in this Area
Purchase History
| Date | Buyer | Sale Price | Title Company |
|---|---|---|---|
| Jeffrey P Goley Ret | -- | None Available | |
| Jeffrey P Goley Ret | -- | None Available | |
| Goley Jeffrey P | -- | -- | |
| Goley Jeffrey P | -- | -- | |
| Goley Jeffrey P | $9,000 | -- |
Source: Public Records
Mortgage History
| Date | Status | Borrower | Loan Amount |
|---|---|---|---|
| Previous Owner | Goley Jeffrey P | $30,000 |
Source: Public Records
Tax History
| Year | Tax Paid | Tax Assessment Tax Assessment Total Assessment is a certain percentage of the fair market value that is determined by local assessors to be the total taxable value of land and additions on the property. | Land | Improvement |
|---|---|---|---|---|
| 2024 | $4,321 | $251,500 | $57,300 | $194,200 |
| 2023 | $4,070 | $263,800 | $69,600 | $194,200 |
| 2022 | $3,641 | $152,400 | $23,700 | $128,700 |
| 2021 | $3,778 | $152,400 | $23,700 | $128,700 |
| 2020 | $3,840 | $152,400 | $23,700 | $128,700 |
| 2019 | $4,074 | $152,400 | $23,700 | $128,700 |
| 2018 | $3,958 | $152,400 | $23,700 | $128,700 |
| 2017 | $3,901 | $127,000 | $25,900 | $101,100 |
| 2016 | $3,487 | $127,000 | $25,900 | $101,100 |
| 2015 | $3,762 | $127,000 | $25,900 | $101,100 |
| 2013 | -- | $127,000 | $25,900 | $101,100 |
Source: Public Records
Map
Nearby Homes
- 7 James St
- 2480 Main St
- O Main St
- 28 Jodo Way
- 42 Maple St
- 15 Okane Ave
- 16 3rd St
- 105 Alpenhof Rd
- 000 Ridge Rd Unit 28
- 00 Ridge Rd Unit 27
- 206 Lewis Hill Rd
- 1 Agassiz St
- 264 Wing Rd
- 103 River Rd
- 961 Maple St
- 686 Wing Rd
- 0 Thorn Hill Rd Unit 22 5063258
- 61 Thorn Hill Rd
- 99 Whitefield Rd
- 289 Ledgewood Dr
Your Personal Tour Guide
Ask me questions while you tour the home.