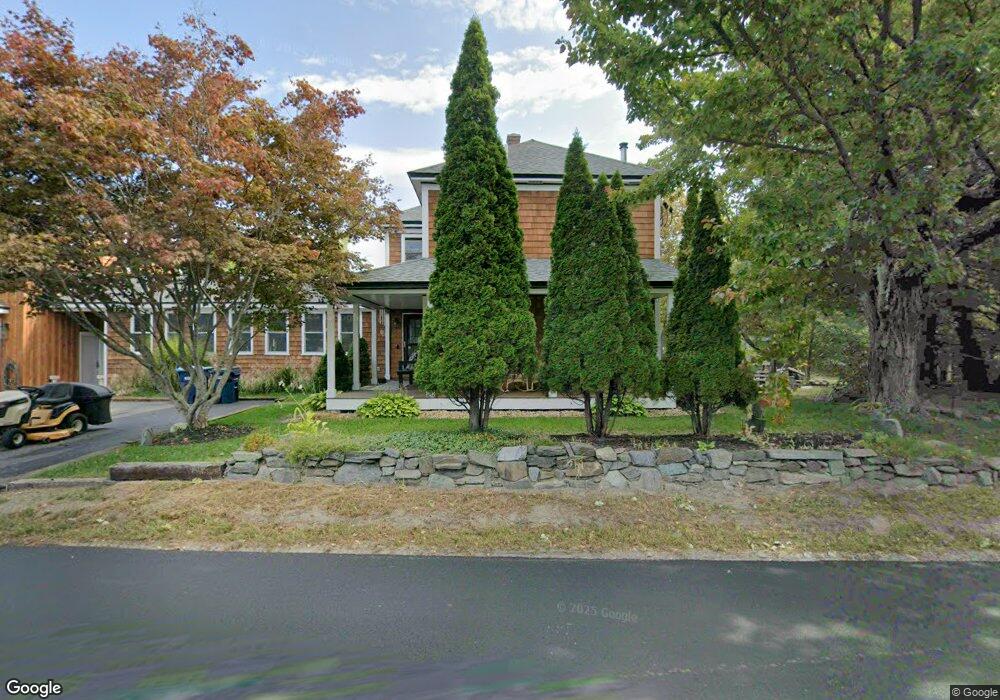
185 Pratts Junction Rd Sterling, MA 01564
Estimated Value: $423,000 - $550,420
3
Beds
3
Baths
1,860
Sq Ft
$266/Sq Ft
Est. Value
About This Home
This home is located at 185 Pratts Junction Rd, Sterling, MA 01564 and is currently estimated at $494,855, approximately $266 per square foot. 185 Pratts Junction Rd is a home located in Worcester County with nearby schools including Wachusett Regional High School and South Lancaster Academy.
Ownership History
Date
Name
Owned For
Owner Type
Purchase Details
Closed on
Oct 9, 2021
Sold by
Longo Christopher M and Longo Eileen F
Bought by
Longo Christopher M and Longo Christina A
Current Estimated Value
Purchase Details
Closed on
Dec 31, 2001
Sold by
Morse William R and Morse Linda J
Bought by
Longo Christopher M and Longo Eileen F
Home Financials for this Owner
Home Financials are based on the most recent Mortgage that was taken out on this home.
Original Mortgage
$166,500
Interest Rate
6.61%
Mortgage Type
Purchase Money Mortgage
Purchase Details
Closed on
Aug 9, 1991
Sold by
Bankers Mutual Trust
Bought by
Morse William R and Linda J Morse
Home Financials for this Owner
Home Financials are based on the most recent Mortgage that was taken out on this home.
Original Mortgage
$122,700
Interest Rate
9.58%
Mortgage Type
Purchase Money Mortgage
Purchase Details
Closed on
May 1, 1991
Sold by
Bankers Mutual Trust
Bought by
Bankers Mutual Trust
Create a Home Valuation Report for This Property
The Home Valuation Report is an in-depth analysis detailing your home's value as well as a comparison with similar homes in the area
Home Values in the Area
Average Home Value in this Area
Purchase History
| Date | Buyer | Sale Price | Title Company |
|---|---|---|---|
| Longo Christopher M | -- | None Available | |
| Longo Christopher M | $185,000 | -- | |
| Morse William R | $124,000 | -- | |
| Bankers Mutual Trust | $5,000 | -- |
Source: Public Records
Mortgage History
| Date | Status | Borrower | Loan Amount |
|---|---|---|---|
| Previous Owner | Bankers Mutual Trust | $166,500 | |
| Previous Owner | Bankers Mutual Trust | $119,994 | |
| Previous Owner | Bankers Mutual Trust | $122,700 |
Source: Public Records
Tax History Compared to Growth
Tax History
| Year | Tax Paid | Tax Assessment Tax Assessment Total Assessment is a certain percentage of the fair market value that is determined by local assessors to be the total taxable value of land and additions on the property. | Land | Improvement |
|---|---|---|---|---|
| 2025 | $5,583 | $433,500 | $118,400 | $315,100 |
| 2024 | $5,003 | $375,900 | $118,400 | $257,500 |
| 2023 | $4,899 | $342,600 | $119,700 | $222,900 |
| 2022 | $3,642 | $238,800 | $108,600 | $130,200 |
| 2021 | $3,758 | $227,500 | $106,400 | $121,100 |
| 2020 | $8,336 | $213,600 | $104,100 | $109,500 |
| 2019 | $3,482 | $201,600 | $104,100 | $97,500 |
| 2018 | $3,278 | $186,900 | $98,300 | $88,600 |
| 2017 | $3,004 | $166,600 | $94,300 | $72,300 |
| 2016 | $3,032 | $165,400 | $94,300 | $71,100 |
| 2015 | $2,917 | $168,700 | $91,600 | $77,100 |
| 2014 | $2,760 | $163,000 | $85,900 | $77,100 |
Source: Public Records
Map
Nearby Homes
- 96 Clinton Rd
- 28 Sandy Ridge Rd
- 121 &125 Flanagan Hill Rd
- 0 Brockelman Rd Unit 73424117
- 2 Stuart Rd
- 765 Brockelman Road Lot C
- 765 Brockelman Rd
- 4 Redstone Hill Rd
- 45 Meetinghouse Hill Rd
- 41 Meetinghouse Hill Rd
- 6 Ashton Ln
- 25 N Row Rd
- 25 North Row
- 5 Leo's Way Unit 1
- 7 Leo's Way Unit 1
- 5 Pine Woods Ln
- 17 Taft Rd
- 54 S Meadow Rd
- 45 Kendall Hill Rd
- 271 Sterling St
- 25 Albright Rd
- 181 Pratts Junction Rd
- 36 Albright Rd
- 27 Albright Rd
- 23 Albright Rd
- 29 Albright Rd
- 173 Pratts Junction Rd
- 47 Chocksett Rd
- Parcel A Pratts Junction Rd
- Lot C Pratts Junction Rd
- 167 Pratts Junction Rd
- 169 Pratts Junction Rd
- 171 Pratts Junction Rd
- 12 Albright Rd
- 2 Village Ln
- 11 Albright Rd
- 8 Albright Rd
- 161 Pratts Junction Rd Unit A-2
- 163 Pratts Junction Rd
- 161 Pratts Junction Rd