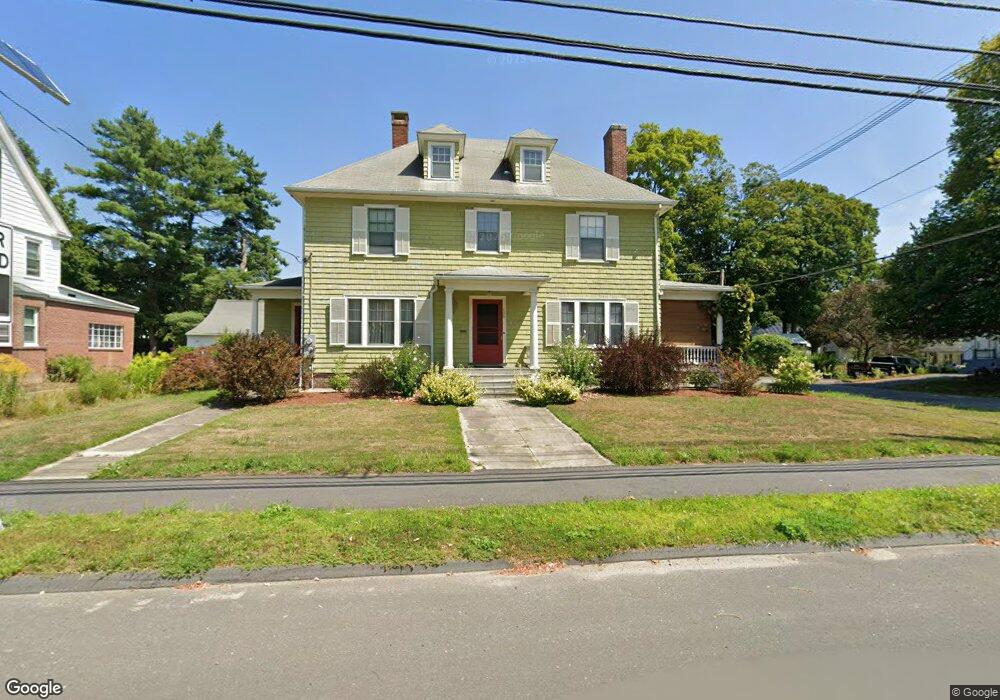
185 S Main St Orange, MA 01364
Estimated Value: $330,168 - $425,000
5
Beds
2
Baths
2,192
Sq Ft
$170/Sq Ft
Est. Value
About This Home
This home is located at 185 S Main St, Orange, MA 01364 and is currently estimated at $373,292, approximately $170 per square foot. 185 S Main St is a home located in Franklin County with nearby schools including Fisher Hill and Ralph C Mahar Regional School.
Ownership History
Date
Name
Owned For
Owner Type
Purchase Details
Closed on
Sep 17, 2007
Sold by
Waters Frank T and Waters John D
Bought by
Elliott Darwin L and Elliott Victoria A
Current Estimated Value
Home Financials for this Owner
Home Financials are based on the most recent Mortgage that was taken out on this home.
Original Mortgage
$210,663
Outstanding Balance
$134,263
Interest Rate
6.7%
Mortgage Type
Purchase Money Mortgage
Estimated Equity
$239,029
Purchase Details
Closed on
Mar 24, 2004
Sold by
Waters Barbara R
Bought by
Waters Frank T and Waters John D
Create a Home Valuation Report for This Property
The Home Valuation Report is an in-depth analysis detailing your home's value as well as a comparison with similar homes in the area
Home Values in the Area
Average Home Value in this Area
Purchase History
| Date | Buyer | Sale Price | Title Company |
|---|---|---|---|
| Elliott Darwin L | $214,000 | -- | |
| Waters Frank T | -- | -- |
Source: Public Records
Mortgage History
| Date | Status | Borrower | Loan Amount |
|---|---|---|---|
| Open | Elliott Darwin L | $210,663 |
Source: Public Records
Tax History
| Year | Tax Paid | Tax Assessment Tax Assessment Total Assessment is a certain percentage of the fair market value that is determined by local assessors to be the total taxable value of land and additions on the property. | Land | Improvement |
|---|---|---|---|---|
| 2025 | $42 | $257,700 | $25,200 | $232,500 |
| 2024 | $4,187 | $240,100 | $25,200 | $214,900 |
| 2023 | $4,186 | $233,100 | $22,700 | $210,400 |
| 2022 | $3,954 | $206,800 | $22,700 | $184,100 |
| 2021 | $3,767 | $187,900 | $42,800 | $145,100 |
| 2020 | $3,682 | $181,100 | $39,100 | $142,000 |
| 2019 | $3,504 | $155,600 | $33,800 | $121,800 |
| 2018 | $3,333 | $151,900 | $31,500 | $120,400 |
| 2017 | $3,225 | $151,900 | $31,500 | $120,400 |
| 2016 | $2,995 | $138,000 | $28,200 | $109,800 |
| 2015 | $2,926 | $140,900 | $30,000 | $110,900 |
| 2014 | $2,843 | $144,000 | $30,000 | $114,000 |
Source: Public Records
Map
Nearby Homes
Your Personal Tour Guide
Ask me questions while you tour the home.