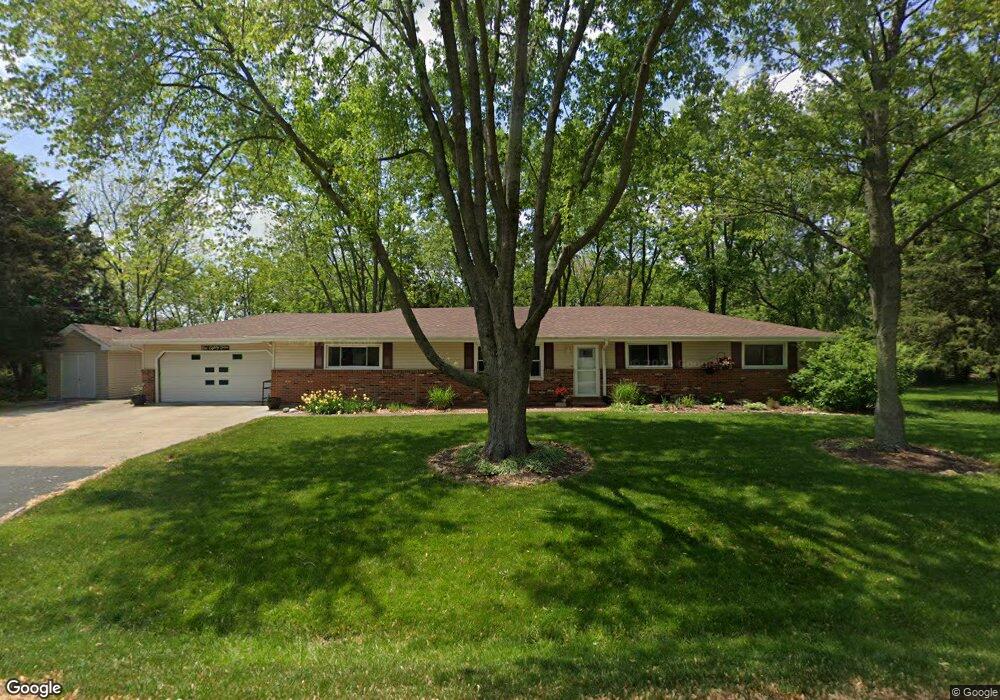
185 Sharp Dr Manhattan, IL 60442
Estimated Value: $270,000 - $348,000
3
Beds
2
Baths
1,794
Sq Ft
$171/Sq Ft
Est. Value
About This Home
This home is located at 185 Sharp Dr, Manhattan, IL 60442 and is currently estimated at $307,163, approximately $171 per square foot. 185 Sharp Dr is a home located in Will County with nearby schools including Wilson Creek Elementary School, Anna McDonald Elementary School, and Manhattan Junior High School.
Ownership History
Date
Name
Owned For
Owner Type
Purchase Details
Closed on
Aug 8, 2008
Sold by
Murphy Susan L
Bought by
Murphy Susan L and Stanfield Debra F
Current Estimated Value
Purchase Details
Closed on
Oct 24, 1997
Sold by
Ring Steven K and King Diana K
Bought by
Osborne Sherrie and Murphy Susan L
Home Financials for this Owner
Home Financials are based on the most recent Mortgage that was taken out on this home.
Original Mortgage
$124,450
Outstanding Balance
$20,082
Interest Rate
7.5%
Estimated Equity
$287,081
Purchase Details
Closed on
Nov 12, 1993
Sold by
Hoffman Albert S and Hoffman Hannah
Bought by
Ring Steven K and Ring Diana K
Home Financials for this Owner
Home Financials are based on the most recent Mortgage that was taken out on this home.
Original Mortgage
$113,700
Interest Rate
6.95%
Mortgage Type
FHA
Create a Home Valuation Report for This Property
The Home Valuation Report is an in-depth analysis detailing your home's value as well as a comparison with similar homes in the area
Home Values in the Area
Average Home Value in this Area
Purchase History
| Date | Buyer | Sale Price | Title Company |
|---|---|---|---|
| Murphy Susan L | -- | None Available | |
| Osborne Sherrie | $131,000 | -- | |
| Ring Steven K | $114,000 | -- |
Source: Public Records
Mortgage History
| Date | Status | Borrower | Loan Amount |
|---|---|---|---|
| Open | Osborne Sherrie | $124,450 | |
| Previous Owner | Ring Steven K | $113,700 |
Source: Public Records
Tax History
| Year | Tax Paid | Tax Assessment Tax Assessment Total Assessment is a certain percentage of the fair market value that is determined by local assessors to be the total taxable value of land and additions on the property. | Land | Improvement |
|---|---|---|---|---|
| 2024 | $7,251 | $80,900 | $26,500 | $54,400 |
| 2023 | $7,251 | $73,200 | $24,200 | $49,000 |
| 2022 | $6,215 | $66,500 | $19,450 | $47,050 |
| 2021 | $5,963 | $63,900 | $19,450 | $44,450 |
| 2020 | $5,840 | $62,550 | $19,450 | $43,100 |
| 2019 | $5,695 | $61,300 | $18,200 | $43,100 |
| 2018 | $5,419 | $58,800 | $18,200 | $40,600 |
| 2017 | $5,286 | $57,250 | $18,200 | $39,050 |
| 2016 | $5,132 | $55,500 | $18,200 | $37,300 |
| 2015 | $4,727 | $53,200 | $17,500 | $35,700 |
| 2014 | $4,727 | $51,400 | $17,500 | $33,900 |
| 2013 | $4,727 | $52,850 | $17,500 | $35,350 |
Source: Public Records
Map
Nearby Homes
- 25426 Barrow Rd
- 25644 Barrow Rd
- 25463 Colligan St
- 25366 Maxwell St Unit 2
- 00 S State St
- 435 S State St
- 25355 Shannon Dr
- 235 Woodrow St
- 25346 Bann St
- 25613 S Riley Erin Rd
- 25181 Faraday Rd
- 479 Fairview Dr
- 25060 Cashel Bay Rd
- 25116 Colligan St
- 0000 Waterford Ln
- 25109 Colligan St
- 16385 Celtic Cir
- 25047 Clare Cir
- 25910 S Manchester Ln
- 25920 S Manchester Ln
Your Personal Tour Guide
Ask me questions while you tour the home.