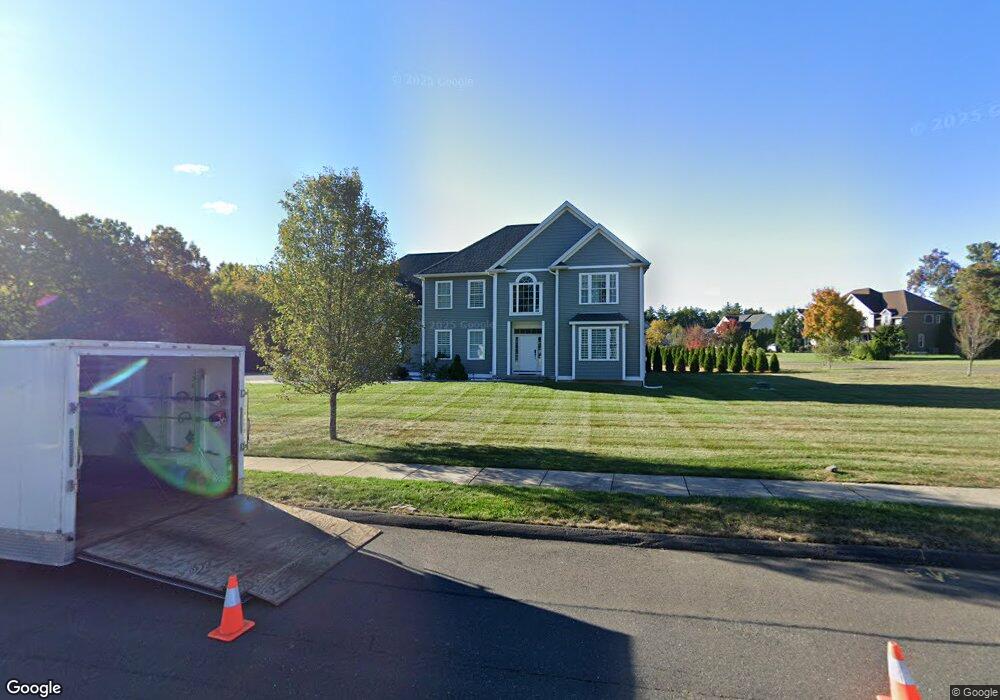
185 W Pines Dr Southington, CT 06489
West Southington NeighborhoodEstimated Value: $915,562 - $1,076,000
6
Beds
4
Baths
3,383
Sq Ft
$298/Sq Ft
Est. Value
About This Home
This home is located at 185 W Pines Dr, Southington, CT 06489 and is currently estimated at $1,009,391, approximately $298 per square foot. 185 W Pines Dr is a home located in Hartford County with nearby schools including Derynoski Elementary School, John F. Kennedy Middle School, and Southington High School.
Ownership History
Date
Name
Owned For
Owner Type
Purchase Details
Closed on
Apr 19, 2021
Sold by
Singh Brahum
Bought by
Singh Brahum and Kaur Satnam
Current Estimated Value
Purchase Details
Closed on
Mar 16, 2021
Sold by
Singh Hardeep
Bought by
Singh Brahum
Purchase Details
Closed on
Dec 17, 2014
Sold by
Dream Estates Llc
Bought by
Singh Brahum and Singh Hardeep
Purchase Details
Closed on
Jul 1, 2013
Sold by
Dbf Llc
Bought by
Fox Michael J and Fox Rose A
Create a Home Valuation Report for This Property
The Home Valuation Report is an in-depth analysis detailing your home's value as well as a comparison with similar homes in the area
Home Values in the Area
Average Home Value in this Area
Purchase History
| Date | Buyer | Sale Price | Title Company |
|---|---|---|---|
| Singh Brahum | -- | None Available | |
| Singh Brahum | -- | None Available | |
| Singh Brahum | -- | None Available | |
| Singh Brahum | -- | None Available | |
| Singh Brahum | $535,000 | -- | |
| Fox Michael J | $175,000 | -- | |
| Singh Brahum | $535,000 | -- | |
| Fox Michael J | $175,000 | -- |
Source: Public Records
Tax History Compared to Growth
Tax History
| Year | Tax Paid | Tax Assessment Tax Assessment Total Assessment is a certain percentage of the fair market value that is determined by local assessors to be the total taxable value of land and additions on the property. | Land | Improvement |
|---|---|---|---|---|
| 2025 | $13,978 | $420,910 | $107,100 | $313,810 |
| 2024 | $13,233 | $420,910 | $107,100 | $313,810 |
| 2023 | $12,779 | $420,910 | $107,100 | $313,810 |
| 2022 | $12,261 | $420,910 | $107,100 | $313,810 |
| 2021 | $12,171 | $419,260 | $107,100 | $312,160 |
| 2020 | $11,441 | $373,530 | $109,300 | $264,230 |
| 2019 | $11,445 | $373,530 | $109,300 | $264,230 |
| 2018 | $11,385 | $373,530 | $109,300 | $264,230 |
| 2017 | $11,385 | $373,530 | $109,300 | $264,230 |
| 2016 | $11,071 | $373,530 | $109,300 | $264,230 |
| 2015 | $10,820 | $371,310 | $104,090 | $267,220 |
| 2014 | $9,395 | $331,280 | $104,090 | $227,190 |
Source: Public Records
Map
Nearby Homes
- 61 Pine Hollow Dr
- 110 W Pines Dr
- 62 Bagno Dr
- 0 Winchester Estates Lot 17
- 103 Mountain Pond Rd
- 206 Mountain Pond Rd
- 554 Spring St
- 132 Walkley Dr
- 1985 West St Unit 11
- 1985 West St Unit 9
- 47 Gannet Dr
- 484 Jude Ln
- 7 Meadow Rd
- 1452 Mount Vernon Rd
- 705 Lake Ave Unit 60
- 519 Village St
- 154 Cascade Ridge
- 45 Hart St
- 39 Morningside Ln
- 81 Laning St
- 185 W Pines Dr
- 173 W Pines Dr
- 153 W Pines Dr
- 226 W Pines Dr
- 466 W Pines Dr
- 227 W Pines Dr
- 186 W Pines Dr
- 219 W Pines Dr
- 219 W Pines Dr
- 491 W Pines Dr
- 172 W Pines Dr
- 226 W Pines Dr
- 146 W Pines Dr
- 461 W Pines Dr
- 452 W Pines Dr
- 160 Whistling Straits Dr
- 138 Whistling Straits Dr
- 148 Whistling Straits Dr
- 126 Whistling Straits Dr
- 54 Pine Hollow Dr