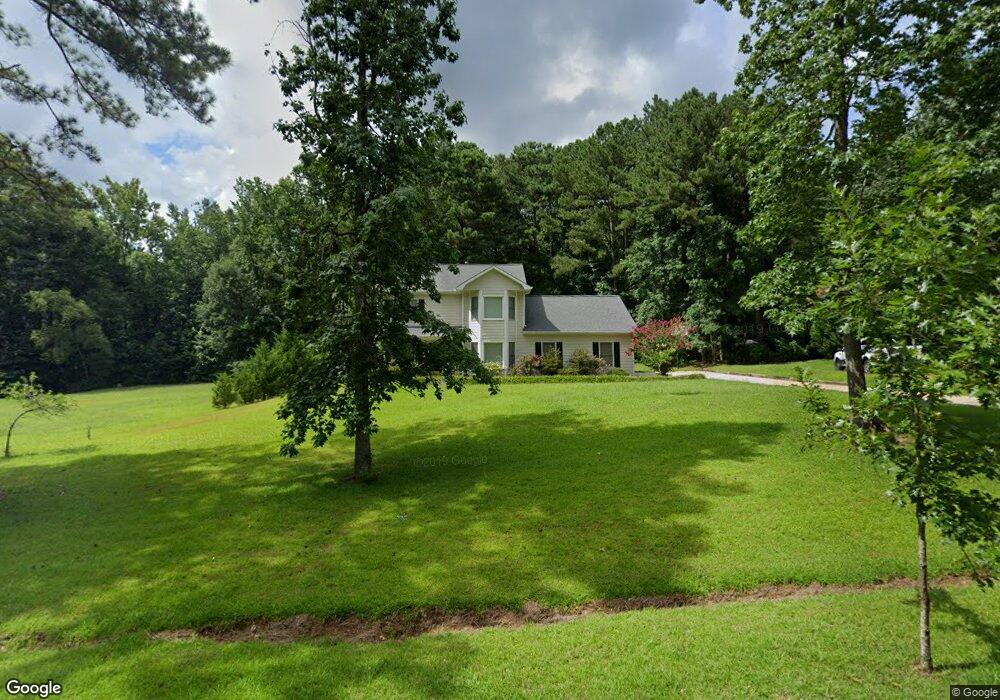
185 Winfair Dr Tyrone, GA 30290
Estimated Value: $376,673 - $464,000
--
Bed
--
Bath
1,938
Sq Ft
$209/Sq Ft
Est. Value
About This Home
This home is located at 185 Winfair Dr, Tyrone, GA 30290 and is currently estimated at $404,418, approximately $208 per square foot. 185 Winfair Dr is a home located in Fayette County with nearby schools including Crabapple Lane Elementary School, Flat Rock Middle School, and Sandy Creek High School.
Ownership History
Date
Name
Owned For
Owner Type
Purchase Details
Closed on
Oct 31, 2001
Sold by
Pitt Mark
Bought by
Ingram Robert C and Ingram Pamela L
Current Estimated Value
Home Financials for this Owner
Home Financials are based on the most recent Mortgage that was taken out on this home.
Original Mortgage
$125,600
Outstanding Balance
$48,910
Interest Rate
6.67%
Mortgage Type
New Conventional
Estimated Equity
$355,508
Purchase Details
Closed on
Jun 10, 1998
Sold by
Reese Rbt and Reese Linda
Bought by
Pitt Mark
Home Financials for this Owner
Home Financials are based on the most recent Mortgage that was taken out on this home.
Original Mortgage
$100,000
Interest Rate
7.14%
Mortgage Type
New Conventional
Purchase Details
Closed on
May 1, 1997
Sold by
Whittenburger William L and Whittenburger Nancy G
Bought by
Reese Robert J and Reese Linda D
Home Financials for this Owner
Home Financials are based on the most recent Mortgage that was taken out on this home.
Original Mortgage
$95,000
Interest Rate
7.95%
Mortgage Type
New Conventional
Create a Home Valuation Report for This Property
The Home Valuation Report is an in-depth analysis detailing your home's value as well as a comparison with similar homes in the area
Home Values in the Area
Average Home Value in this Area
Purchase History
| Date | Buyer | Sale Price | Title Company |
|---|---|---|---|
| Ingram Robert C | $157,000 | -- | |
| Pitt Mark | $125,000 | -- | |
| Reese Robert J | $102,800 | -- |
Source: Public Records
Mortgage History
| Date | Status | Borrower | Loan Amount |
|---|---|---|---|
| Open | Ingram Robert C | $125,600 | |
| Previous Owner | Pitt Mark | $100,000 | |
| Previous Owner | Reese Robert J | $95,000 |
Source: Public Records
Tax History Compared to Growth
Tax History
| Year | Tax Paid | Tax Assessment Tax Assessment Total Assessment is a certain percentage of the fair market value that is determined by local assessors to be the total taxable value of land and additions on the property. | Land | Improvement |
|---|---|---|---|---|
| 2024 | $2,828 | $128,768 | $20,000 | $108,768 |
| 2023 | $2,360 | $123,440 | $20,000 | $103,440 |
| 2022 | $2,563 | $104,080 | $20,000 | $84,080 |
| 2021 | $2,389 | $89,880 | $20,000 | $69,880 |
| 2020 | $2,413 | $79,760 | $14,400 | $65,360 |
| 2019 | $2,322 | $76,120 | $14,400 | $61,720 |
| 2018 | $2,201 | $71,560 | $14,400 | $57,160 |
| 2017 | $2,131 | $69,120 | $14,400 | $54,720 |
| 2016 | $1,951 | $62,320 | $14,400 | $47,920 |
| 2015 | $1,842 | $58,040 | $14,400 | $43,640 |
| 2014 | $1,636 | $51,000 | $14,400 | $36,600 |
| 2013 | -- | $49,040 | $0 | $0 |
Source: Public Records
Map
Nearby Homes
- 135 Crimson Ridge
- 130 E Crestwood Rd
- 2185 Castle Lake Dr
- 105 Farmington Dr
- 100 Leisure Trail
- 240 Lynnwood Ave
- 475 Castlewood Rd
- 100 Clydesdale Ct
- 152 Ardenlee Dr
- 185 Newfield Dr Unit 1
- 110 Sutton Ct
- 320 Dalston Way
- 150 Kylemore Pass
- 249 Clifton Ln
- 100 Ashland Trail
- 308 Dalston Way
- 140 Devonshire Place
- 231 Clifton Ln
- 104 Ashland Trail
- 103 Ardenlee Dr
- 175 Winfair Dr
- 195 Winfair Dr
- 180 Winfair Dr
- 165 Winfair Dr
- 190 Winfair Dr
- 0 Winfair Dr Unit 7500724
- 0 Winfair Dr Unit 7426907
- 0 Winfair Dr Unit 8250099
- 0 Winfair Dr Unit 9051187
- 0 Winfair Dr Unit 8837742
- 0 Winfair Dr Unit 3258503
- 0 Winfair Dr Unit 7249876
- 0 Winfair Dr Unit 8172377
- 170 Winfair Dr
- 160 Winfair Dr
- 200 Winfair Dr
- 215 Winfair Dr
- 215 Winfair Dr
- 215 Winfair Dr
- 215 Winfair Dr Unit 215