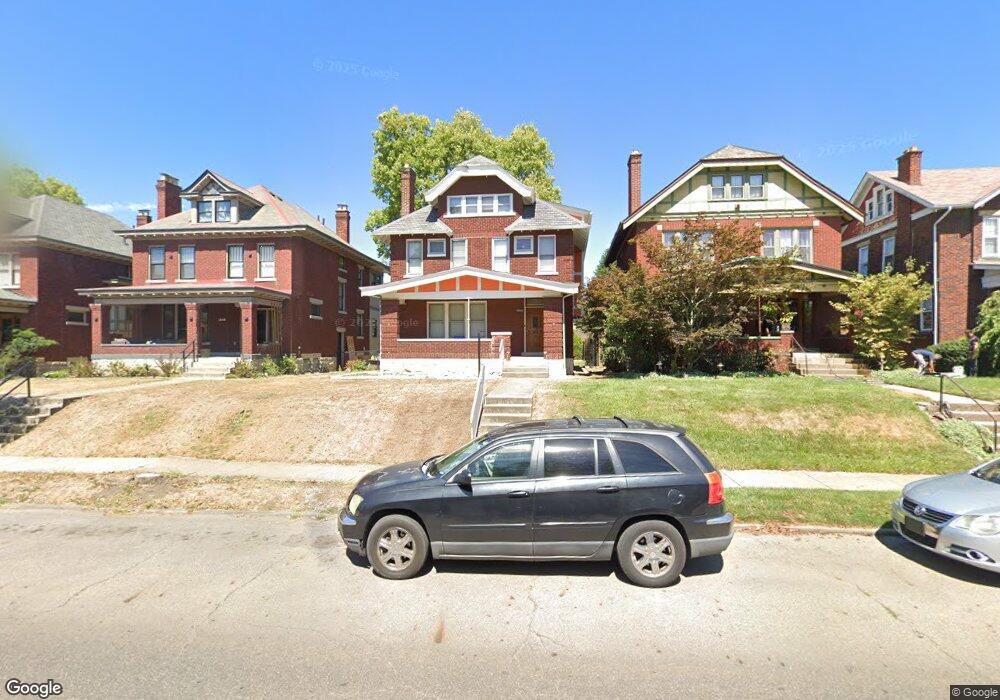
1850 Bryden Rd Columbus, OH 43205
Franklin Park NeighborhoodEstimated Value: $300,000 - $482,000
5
Beds
1
Bath
2,840
Sq Ft
$148/Sq Ft
Est. Value
About This Home
This home is located at 1850 Bryden Rd, Columbus, OH 43205 and is currently estimated at $419,111, approximately $147 per square foot. 1850 Bryden Rd is a home located in Franklin County with nearby schools including Ohio Avenue Elementary School, Champion Middle School, and East High School.
Ownership History
Date
Name
Owned For
Owner Type
Purchase Details
Closed on
Sep 26, 2008
Sold by
Vanderveen Cornelis J and Pahl Bryan E
Bought by
Robinson April C
Current Estimated Value
Home Financials for this Owner
Home Financials are based on the most recent Mortgage that was taken out on this home.
Original Mortgage
$125,839
Outstanding Balance
$82,304
Interest Rate
6.43%
Mortgage Type
FHA
Estimated Equity
$336,807
Purchase Details
Closed on
Mar 26, 1999
Sold by
Tyson Renny J
Bought by
Vanderveen Cornelis J and Pahl Bryan E
Home Financials for this Owner
Home Financials are based on the most recent Mortgage that was taken out on this home.
Original Mortgage
$131,900
Interest Rate
6.89%
Mortgage Type
FHA
Purchase Details
Closed on
May 13, 1997
Sold by
Tyson Renny J and Tyson Linda L
Bought by
Tyson Renny J
Create a Home Valuation Report for This Property
The Home Valuation Report is an in-depth analysis detailing your home's value as well as a comparison with similar homes in the area
Home Values in the Area
Average Home Value in this Area
Purchase History
| Date | Buyer | Sale Price | Title Company |
|---|---|---|---|
| Robinson April C | $127,500 | Valmer Land | |
| Vanderveen Cornelis J | $133,000 | Chicago Title | |
| Tyson Renny J | -- | Title First Agency Inc |
Source: Public Records
Mortgage History
| Date | Status | Borrower | Loan Amount |
|---|---|---|---|
| Open | Robinson April C | $125,839 | |
| Previous Owner | Vanderveen Cornelis J | $131,900 |
Source: Public Records
Tax History
| Year | Tax Paid | Tax Assessment Tax Assessment Total Assessment is a certain percentage of the fair market value that is determined by local assessors to be the total taxable value of land and additions on the property. | Land | Improvement |
|---|---|---|---|---|
| 2025 | $9,325 | $114,630 | $43,930 | $70,700 |
| 2024 | $9,325 | $114,630 | $43,930 | $70,700 |
| 2023 | $5,079 | $114,625 | $43,925 | $70,700 |
| 2022 | $6,213 | $79,810 | $7,110 | $72,700 |
| 2021 | $4,147 | $79,810 | $7,110 | $72,700 |
| 2020 | $4,152 | $79,810 | $7,110 | $72,700 |
| 2019 | $3,873 | $63,850 | $5,710 | $58,140 |
| 2018 | $3,531 | $63,850 | $5,710 | $58,140 |
| 2017 | $3,697 | $63,850 | $5,710 | $58,140 |
| 2016 | $3,522 | $53,170 | $5,530 | $47,640 |
| 2015 | $3,197 | $53,170 | $5,530 | $47,640 |
| 2014 | $3,205 | $53,170 | $5,530 | $47,640 |
| 2013 | $1,437 | $48,335 | $5,040 | $43,295 |
Source: Public Records
Map
Nearby Homes
- 1847 Oak St
- 403 Fairwood Ave
- 1815 Franklin Park S Unit S
- 1703 Bryden Rd
- 1779 E Main St
- 423 Stoddart Ave
- 1707 E Main St Unit 1705
- 409-411 Morrison Ave
- 415-417 Morrison Ave
- 384-386 Berkeley Rd
- 572 Bulen Ave
- 377 Berkeley Rd
- 592 Rhoads Ave Unit 594
- 1579 Tiffin St
- 544 Seymour Ave
- 1570 E Rich St
- 211 Preston Rd
- 1555-1557 E Rich St
- 436 S Parkview Ave
- 489 Lilley Ave
- 1856 Bryden Rd
- 1846 Bryden Rd
- 1862 Bryden Rd
- 1840 Bryden Rd
- 1868 Bryden Rd
- 1834 Bryden Rd
- 1828 Bryden Rd
- 1851 Franklin Ave
- 1859 Franklin Ave
- 1865 Franklin Ave
- 1845 Franklin Ave
- 1863 Bryden Rd
- 1837 Franklin Ave
- 1822 Bryden Rd
- 1847 Bryden Rd
- 1851 Bryden Rd Unit 853
- 1857 Bryden Rd Unit 859
- 1841 Bryden Rd
- 1861 Bryden Rd Unit 863
- 1835 Bryden Rd
Your Personal Tour Guide
Ask me questions while you tour the home.