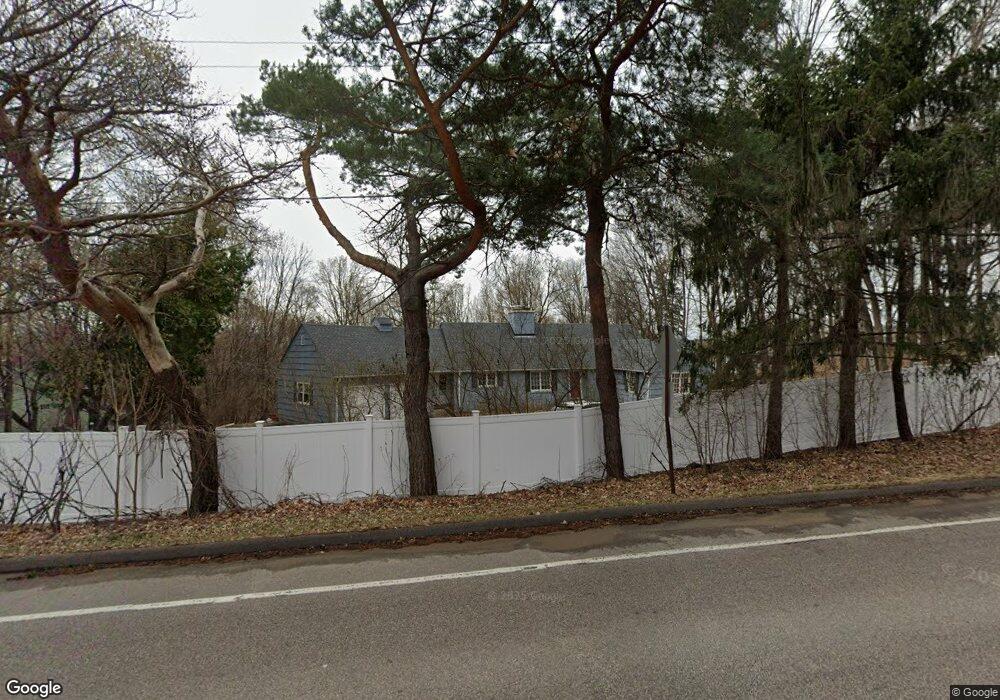
18505 18505 Minnetonka-Boulevard- Deephaven, MN 55391
Estimated Value: $782,000 - $883,000
4
Beds
2
Baths
1,728
Sq Ft
$473/Sq Ft
Est. Value
About This Home
This home is located at 18505 18505 Minnetonka-Boulevard-, Deephaven, MN 55391 and is currently estimated at $817,859, approximately $473 per square foot. 18505 18505 Minnetonka-Boulevard- is a home located in Hennepin County with nearby schools including Deephaven Elementary School, Minnetonka East Middle School, and Minnetonka Senior High School.
Ownership History
Date
Name
Owned For
Owner Type
Purchase Details
Closed on
Oct 24, 2024
Sold by
Crow Kelsey and Aquilar Douglas
Bought by
Crow Kelsey and Crow Kirby
Current Estimated Value
Purchase Details
Closed on
Jun 16, 2021
Sold by
Crow Nicholas
Bought by
Crow Jared and Crow Chandler
Purchase Details
Closed on
Jan 22, 2020
Sold by
Crow Sharon T
Bought by
Crow Sharon T and Crow Jared
Purchase Details
Closed on
Jul 20, 2010
Sold by
Gallagher Dominic and Gallagher Angela M
Bought by
Crow Sharon T and Crow Stephen Bradshaw
Purchase Details
Closed on
Aug 31, 2001
Sold by
Dodd Geoffrey J and Dodd Lucy P
Bought by
Barnheiser Robert B and Barnheiser Angela M
Purchase Details
Closed on
Sep 12, 2000
Sold by
E Louise Schuster Revocable Trust
Bought by
Dd Geoffrey J
Create a Home Valuation Report for This Property
The Home Valuation Report is an in-depth analysis detailing your home's value as well as a comparison with similar homes in the area
Home Values in the Area
Average Home Value in this Area
Purchase History
| Date | Buyer | Sale Price | Title Company |
|---|---|---|---|
| Crow Kelsey | $500 | None Listed On Document | |
| Crow Kelsey | $500 | None Listed On Document | |
| Crow Jared | -- | None Available | |
| Crow Sharon T | -- | None Listed On Document | |
| Crow Sharon T | $510,000 | -- | |
| Barnheiser Robert B | $329,000 | -- | |
| Dd Geoffrey J | $260,000 | -- |
Source: Public Records
Tax History Compared to Growth
Tax History
| Year | Tax Paid | Tax Assessment Tax Assessment Total Assessment is a certain percentage of the fair market value that is determined by local assessors to be the total taxable value of land and additions on the property. | Land | Improvement |
|---|---|---|---|---|
| 2024 | $9,169 | $773,800 | $414,000 | $359,800 |
| 2023 | $8,897 | $767,000 | $414,000 | $353,000 |
| 2022 | $7,247 | $711,000 | $205,000 | $506,000 |
| 2021 | $6,986 | $595,000 | $163,000 | $432,000 |
| 2020 | $7,188 | $576,000 | $163,000 | $413,000 |
| 2019 | $7,206 | $570,000 | $162,000 | $408,000 |
| 2018 | $6,987 | $574,000 | $162,000 | $412,000 |
| 2017 | $7,030 | $557,000 | $162,000 | $395,000 |
| 2016 | $6,881 | $539,000 | $183,000 | $356,000 |
| 2015 | $6,942 | $539,000 | $183,000 | $356,000 |
| 2014 | -- | $494,000 | $153,000 | $341,000 |
Source: Public Records
Map
Nearby Homes
- 18505 Minnetonka Blvd
- 3922 Heathcote Rd
- 4015 E Valley Rd
- 18540 Azure Rd
- 4195 Hillcrest Ln
- 18545 Rutledge Rd
- 18965 Lake Ave
- 3900 Hillcrest Way
- 3815 Deephaven Ave
- 18925 Easton Rd
- 18065 Berry Ln
- 18800 Highland Avenue
- 18800 Highland Ave
- 19100 Rutledge Rd
- 17820 Valley Cove Ct
- Manchester Plan at Ridgewood Ponds
- Broadmoor Plan at Ridgewood Ponds
- 3655 Northome Rd
- 3500 Leroy St
- 18995 Maple Ln
- 18505 18505 Minnetonka Blvd
- 3922 3922 Heathcote Rd
- 3921 Tramore Ln
- 18550 Minnetonka Blvd
- 18600 Minnetonka Blvd
- 18600 18600 Minnetonka Blvd
- 3909 Heathcote Rd
- 18600 Minnetonka Blvd
- 18505 Heathcote Ln
- 3954 Heathcote Rd
- 3923 Tramore Ln
- 3922 Tramore Ln
- 3922 Tramore Ln
- 3924 Tramore Ln
- 18650 Minnetonka Blvd
- 18409 Minnetonka Blvd
- 3971 Heathcote Rd
- 18473 Heathcote Ln
- 3986 Heathcote Rd
- 3845 Virginia Ave