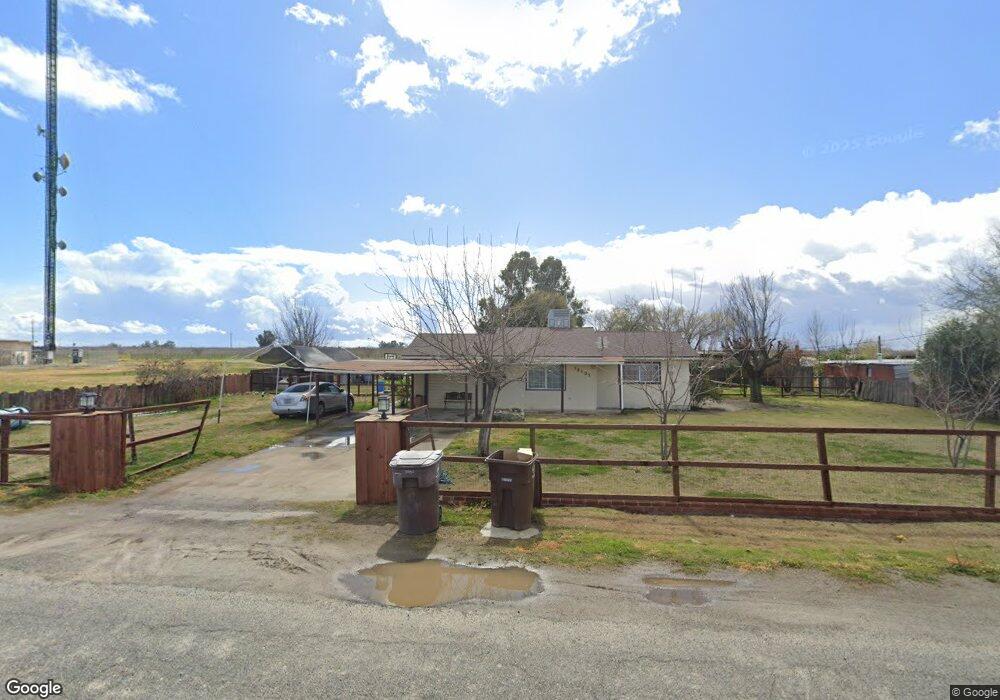
18505 Java Ave Lemoore, CA 93245
Estimated Value: $265,000 - $374,000
2
Beds
1
Bath
888
Sq Ft
$365/Sq Ft
Est. Value
About This Home
This home is located at 18505 Java Ave, Lemoore, CA 93245 and is currently estimated at $324,234, approximately $365 per square foot. 18505 Java Ave is a home located in Kings County with nearby schools including Central Elementary School and Lemoore High School.
Ownership History
Date
Name
Owned For
Owner Type
Purchase Details
Closed on
Sep 17, 2024
Sold by
Ledesma J Guadalupe
Bought by
Ledesma J Guadalupe J and Ledesma Elida
Current Estimated Value
Home Financials for this Owner
Home Financials are based on the most recent Mortgage that was taken out on this home.
Original Mortgage
$200,000
Outstanding Balance
$197,760
Interest Rate
6.49%
Mortgage Type
New Conventional
Estimated Equity
$126,474
Purchase Details
Closed on
Jun 28, 2005
Sold by
Karlowitsch John W
Bought by
Ledesma J Guadalupe
Home Financials for this Owner
Home Financials are based on the most recent Mortgage that was taken out on this home.
Original Mortgage
$190,000
Interest Rate
5.51%
Mortgage Type
Fannie Mae Freddie Mac
Purchase Details
Closed on
Jul 18, 2000
Sold by
Weathers Edmund Jr Living Trust
Bought by
Karlowitsch John W
Create a Home Valuation Report for This Property
The Home Valuation Report is an in-depth analysis detailing your home's value as well as a comparison with similar homes in the area
Purchase History
| Date | Buyer | Sale Price | Title Company |
|---|---|---|---|
| Ledesma J Guadalupe J | -- | Fidelity National Title | |
| Ledesma J Guadalupe | $200,000 | Stewart Title Co | |
| Karlowitsch John W | $79,000 | -- |
Source: Public Records
Mortgage History
| Date | Status | Borrower | Loan Amount |
|---|---|---|---|
| Open | Ledesma J Guadalupe J | $200,000 | |
| Previous Owner | Ledesma J Guadalupe | $190,000 |
Source: Public Records
Tax History
| Year | Tax Paid | Tax Assessment Tax Assessment Total Assessment is a certain percentage of the fair market value that is determined by local assessors to be the total taxable value of land and additions on the property. | Land | Improvement |
|---|---|---|---|---|
| 2025 | $2,721 | $273,313 | $167,226 | $106,087 |
| 2023 | $2,721 | $262,702 | $160,734 | $101,968 |
| 2022 | $2,866 | $257,552 | $157,583 | $99,969 |
| 2021 | $2,796 | $252,503 | $154,494 | $98,009 |
| 2020 | $2,776 | $249,914 | $152,910 | $97,004 |
| 2019 | $2,749 | $245,014 | $149,912 | $95,102 |
| 2018 | $2,644 | $240,210 | $146,973 | $93,237 |
| 2017 | $2,636 | $235,500 | $144,091 | $91,409 |
| 2016 | $2,480 | $230,883 | $141,266 | $89,617 |
| 2015 | $2,469 | $227,415 | $139,144 | $88,271 |
| 2014 | $2,398 | $222,960 | $136,418 | $86,542 |
Source: Public Records
Map
Nearby Homes
- 18531 Java Ave
- 18464 Java Ave
- 18585 Java Ave
- 18619 Java Ave
- 18420 Java Ave
- 18390 Java Ave
- 18317 Java Ave
- 18309 Java Ave
- 18279 Java Ave
- 18348 Kent Ave
- 16395 19th Ave
- 18531 Jersey Ave
- 18433 Kent Ave
- 16502 19th Ave
- 18262 Kent Ave
- 16210 18th Ave
- 18479 Kent Ave
- 16412 S 19th Ave
- 18221 Jersey Ave
- 16283 18th Ave
Your Personal Tour Guide
Ask me questions while you tour the home.