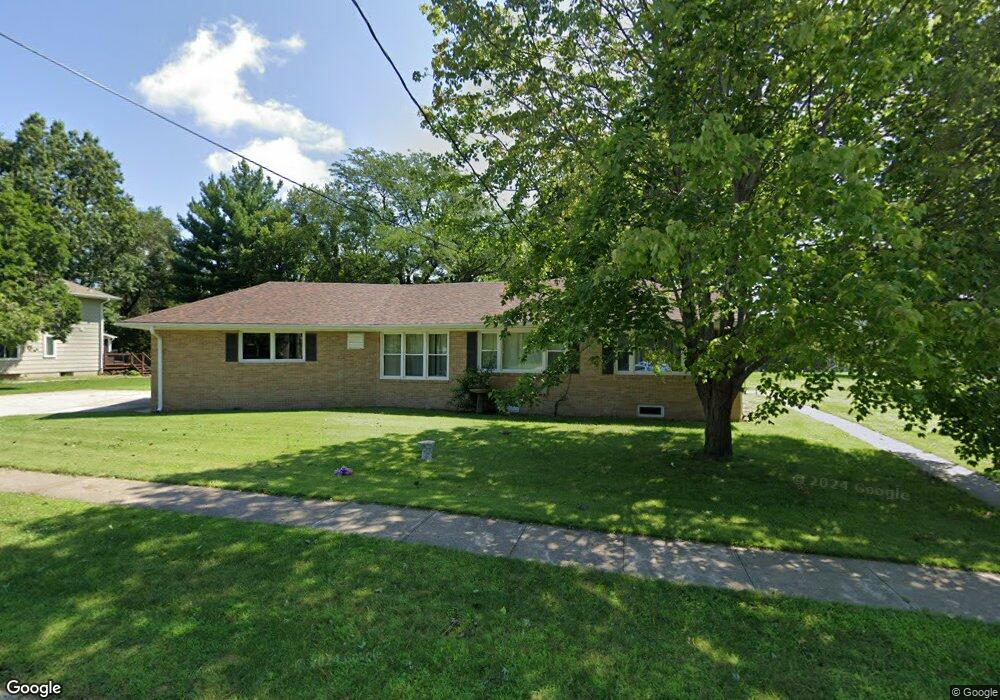
1851 Ashworth Rd West Des Moines, IA 50265
Estimated Value: $304,000 - $399,000
2
Beds
2
Baths
2,332
Sq Ft
$157/Sq Ft
Est. Value
About This Home
This home is located at 1851 Ashworth Rd, West Des Moines, IA 50265 and is currently estimated at $366,359, approximately $157 per square foot. 1851 Ashworth Rd is a home located in Polk County with nearby schools including Fairmeadows Elementary School, Stilwell Junior High School, and Valley Southwoods Freshman High School.
Ownership History
Date
Name
Owned For
Owner Type
Purchase Details
Closed on
Sep 4, 2013
Sold by
Mid Iowa Plaza Llc
Bought by
Etzel Robert F and Robert F Etzel Living Trust
Current Estimated Value
Home Financials for this Owner
Home Financials are based on the most recent Mortgage that was taken out on this home.
Original Mortgage
$1,000,000
Interest Rate
4.29%
Mortgage Type
Credit Line Revolving
Create a Home Valuation Report for This Property
The Home Valuation Report is an in-depth analysis detailing your home's value as well as a comparison with similar homes in the area
Home Values in the Area
Average Home Value in this Area
Purchase History
| Date | Buyer | Sale Price | Title Company |
|---|---|---|---|
| Etzel Robert F | $2,300,000 | None Available |
Source: Public Records
Mortgage History
| Date | Status | Borrower | Loan Amount |
|---|---|---|---|
| Previous Owner | Etzel Robert F | $1,000,000 |
Source: Public Records
Tax History Compared to Growth
Tax History
| Year | Tax Paid | Tax Assessment Tax Assessment Total Assessment is a certain percentage of the fair market value that is determined by local assessors to be the total taxable value of land and additions on the property. | Land | Improvement |
|---|---|---|---|---|
| 2025 | $5,256 | $391,600 | $79,100 | $312,500 |
| 2024 | $5,256 | $349,100 | $69,300 | $279,800 |
| 2023 | $5,200 | $349,100 | $69,300 | $279,800 |
| 2022 | $5,138 | $278,200 | $58,200 | $220,000 |
| 2021 | $4,870 | $278,200 | $58,200 | $220,000 |
| 2020 | $4,792 | $251,400 | $52,300 | $199,100 |
| 2019 | $4,566 | $251,400 | $52,300 | $199,100 |
| 2018 | $4,572 | $231,400 | $47,000 | $184,400 |
| 2017 | $4,430 | $231,400 | $47,000 | $184,400 |
| 2016 | $4,330 | $218,100 | $43,500 | $174,600 |
| 2015 | $4,330 | $218,100 | $43,500 | $174,600 |
| 2014 | $4,422 | $211,700 | $41,400 | $170,300 |
Source: Public Records
Map
Nearby Homes
- 2013 Crown Flair Dr
- 2100 Meadow Brook Dr Unit 103
- 1006 22nd St
- 1114 22nd St
- 1909 Prospect Ave
- 1230 16th St
- 842 23rd St
- 725 20th St
- 1827 Pleasant St
- 720 19th St
- 542 Bella St
- 1809 Pearl Dr
- 1829 Pearl Dr
- 924 13th St
- 904 13th St
- 2412 Fairlawn Dr
- 2509 Fairlawn Dr
- 800 13th St
- 2009 Vine St
- 2408 Pleasant St