1851 Bush St Red Wing, MN 55066
Estimated Value: $220,229 - $257,000
3
Beds
2
Baths
1,306
Sq Ft
$179/Sq Ft
Est. Value
About This Home
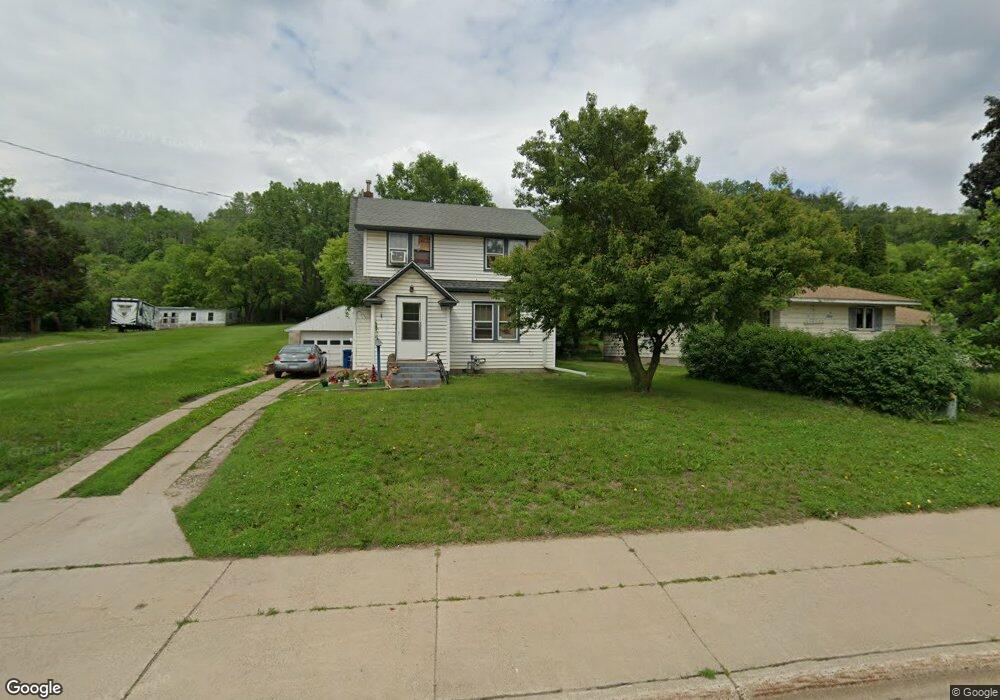
This home is located at 1851 Bush St, Red Wing, MN 55066 and is currently estimated at $234,307, approximately $179 per square foot. 1851 Bush St is a home located in Goodhue County with nearby schools including Sunnyside Elementary School, Burnside Elementary School, and Twin Bluff Middle School.
Ownership History
Date
Name
Owned For
Owner Type
Purchase Details
Closed on
Feb 1, 2017
Bought by
Bird Michael
Current Estimated Value
Home Financials for this Owner
Home Financials are based on the most recent Mortgage that was taken out on this home.
Original Mortgage
$110,225
Outstanding Balance
$91,080
Interest Rate
4.3%
Estimated Equity
$143,227
Purchase Details
Closed on
Jan 23, 2017
Sold by
Federal National Mortgage Association
Bought by
Bird Michael A
Home Financials for this Owner
Home Financials are based on the most recent Mortgage that was taken out on this home.
Original Mortgage
$110,225
Outstanding Balance
$91,080
Interest Rate
4.3%
Estimated Equity
$143,227
Purchase Details
Closed on
Apr 24, 2006
Sold by
Henke Kristoffer E and Henke Michelle M
Bought by
Plascencia Jose and Melendrez Guadalupe
Purchase Details
Closed on
Dec 7, 1998
Sold by
Hoover Karolyn J
Bought by
Henke Kristoffer E and Henke Michelle M
Create a Home Valuation Report for This Property
The Home Valuation Report is an in-depth analysis detailing your home's value as well as a comparison with similar homes in the area
Home Values in the Area
Average Home Value in this Area
Purchase History
| Date | Buyer | Sale Price | Title Company |
|---|---|---|---|
| Bird Michael | $115,500 | -- | |
| Bird Michael A | -- | None Available | |
| Plascencia Jose | $126,000 | -- | |
| Henke Kristoffer E | $34,750 | -- | |
| Henke Kristoffer E | $34,750 | -- |
Source: Public Records
Mortgage History
| Date | Status | Borrower | Loan Amount |
|---|---|---|---|
| Open | Bird Michael | $110,225 |
Source: Public Records
Tax History Compared to Growth
Tax History
| Year | Tax Paid | Tax Assessment Tax Assessment Total Assessment is a certain percentage of the fair market value that is determined by local assessors to be the total taxable value of land and additions on the property. | Land | Improvement |
|---|---|---|---|---|
| 2025 | $2,160 | $188,200 | $40,600 | $147,600 |
| 2024 | $2,160 | $185,400 | $40,600 | $144,800 |
| 2023 | $1,102 | $175,800 | $40,600 | $135,200 |
| 2022 | $1,878 | $174,800 | $40,600 | $134,200 |
| 2021 | $1,746 | $146,000 | $35,700 | $110,300 |
| 2020 | $1,784 | $138,900 | $35,700 | $103,200 |
| 2019 | $1,758 | $133,400 | $35,700 | $97,700 |
| 2018 | $1,378 | $133,200 | $32,500 | $100,700 |
| 2017 | $1,686 | $117,100 | $32,500 | $84,600 |
| 2016 | $1,234 | $115,500 | $32,500 | $83,000 |
| 2015 | $1,180 | $112,700 | $32,500 | $80,200 |
| 2014 | -- | $108,300 | $32,500 | $75,800 |
Source: Public Records
Map
Nearby Homes