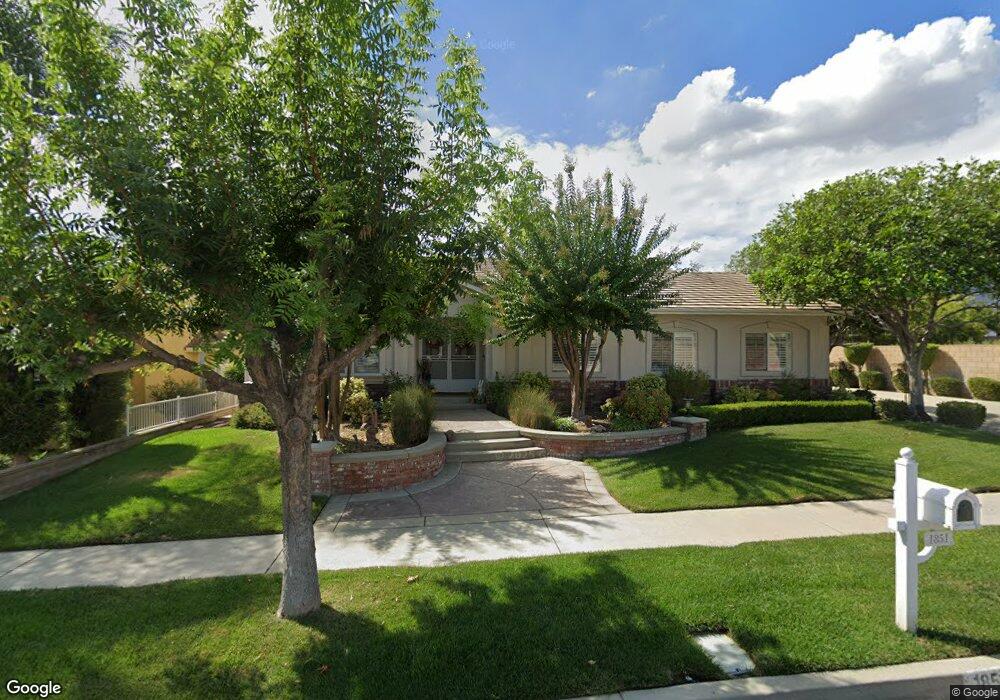
1851 N Christopher Ave Upland, CA 91784
Estimated Value: $1,025,000 - $1,193,000
4
Beds
3
Baths
2,751
Sq Ft
$404/Sq Ft
Est. Value
About This Home
This home is located at 1851 N Christopher Ave, Upland, CA 91784 and is currently estimated at $1,112,516, approximately $404 per square foot. 1851 N Christopher Ave is a home located in San Bernardino County with nearby schools including Sierra Vista Elementary School, Pioneer Junior High School, and Upland High School.
Ownership History
Date
Name
Owned For
Owner Type
Purchase Details
Closed on
May 31, 2024
Sold by
Jennings Stanley Dewayne and Jennings Nancy Jean
Bought by
Jennings Revocable Trust and Jennings
Current Estimated Value
Purchase Details
Closed on
Jul 30, 2001
Sold by
Stewart Linda
Bought by
Jennings Stanley D and Jennings Nancy J
Home Financials for this Owner
Home Financials are based on the most recent Mortgage that was taken out on this home.
Original Mortgage
$300,000
Interest Rate
7%
Mortgage Type
Seller Take Back
Purchase Details
Closed on
Sep 27, 2000
Sold by
Stewart Ray M
Bought by
Stewart Ray and Stewart Linda
Purchase Details
Closed on
Sep 15, 2000
Sold by
Richardson Thomas Earl
Bought by
Richardson Thomas E and Richardson Margie A
Purchase Details
Closed on
Dec 17, 1997
Sold by
San Gabriel Properties
Bought by
Stewart Ray M and Stewart Linda M
Create a Home Valuation Report for This Property
The Home Valuation Report is an in-depth analysis detailing your home's value as well as a comparison with similar homes in the area
Home Values in the Area
Average Home Value in this Area
Purchase History
| Date | Buyer | Sale Price | Title Company |
|---|---|---|---|
| Jennings Revocable Trust | -- | None Listed On Document | |
| Jennings Stanley D | $350,000 | North American Title Co | |
| Stewart Ray | -- | -- | |
| Richardson Thomas E | -- | -- | |
| Stewart Ray M | $350,000 | First American Title Ins Co |
Source: Public Records
Mortgage History
| Date | Status | Borrower | Loan Amount |
|---|---|---|---|
| Previous Owner | Jennings Stanley D | $300,000 |
Source: Public Records
Tax History
| Year | Tax Paid | Tax Assessment Tax Assessment Total Assessment is a certain percentage of the fair market value that is determined by local assessors to be the total taxable value of land and additions on the property. | Land | Improvement |
|---|---|---|---|---|
| 2025 | $5,897 | $537,342 | $180,976 | $356,366 |
| 2024 | $5,709 | $526,805 | $177,427 | $349,378 |
| 2023 | $5,622 | $516,475 | $173,948 | $342,527 |
| 2022 | $5,500 | $506,348 | $170,537 | $335,811 |
| 2021 | $5,492 | $496,419 | $167,193 | $329,226 |
| 2020 | $5,342 | $491,329 | $165,479 | $325,850 |
| 2019 | $5,323 | $481,695 | $162,234 | $319,461 |
| 2018 | $5,192 | $472,250 | $159,053 | $313,197 |
| 2017 | $5,041 | $462,990 | $155,934 | $307,056 |
| 2016 | $4,821 | $453,911 | $152,876 | $301,035 |
| 2015 | $4,710 | $447,093 | $150,580 | $296,513 |
| 2014 | $4,588 | $438,335 | $147,630 | $290,705 |
Source: Public Records
Map
Nearby Homes
- 1844 N 1st Ave
- 252 W 19th St
- 256 W 18th St
- 1695 N Palm Ave
- 1238 Leggio Ln
- 1060 Pebble Beach Dr Unit 58
- 1629 N Palm Ave
- 1267 Kendra Ln
- 141 W 21st St
- 612 W 17th St
- 1767 Seth Loop W
- 779 Coral Tree Way
- 2162 N Euclid Ave
- 1842 Richards Place
- 1742 N Albright Ave
- 2205 N Euclid Ave
- 635 W 16th St
- 1623 N Vallejo Way
- 689 E Cumberland St
- 1669 N San Antonio Ave
- 1843 N Christopher Ave
- 349 Savannah Ct
- 352 Savannah Ct
- 1835 N Christopher Ave
- 1852 N Christopher Ave
- 1842 N Christopher Ave
- 440 Citrus Union St
- 350 Savannah Ct
- 1850 N 3rd Ave
- 333 Savannah Ct
- 1827 N Christopher Ave
- 432 Citrus Union St
- 1832 N Christopher Ave
- 454 Citrus Union St
- 425 E Nicole Ct
- 426 Citrus Union St
- 435 E Nicole Ct
- 336 Savannah Ct
- 1819 N Christopher Ave
- 460 Citrus Union St
Your Personal Tour Guide
Ask me questions while you tour the home.