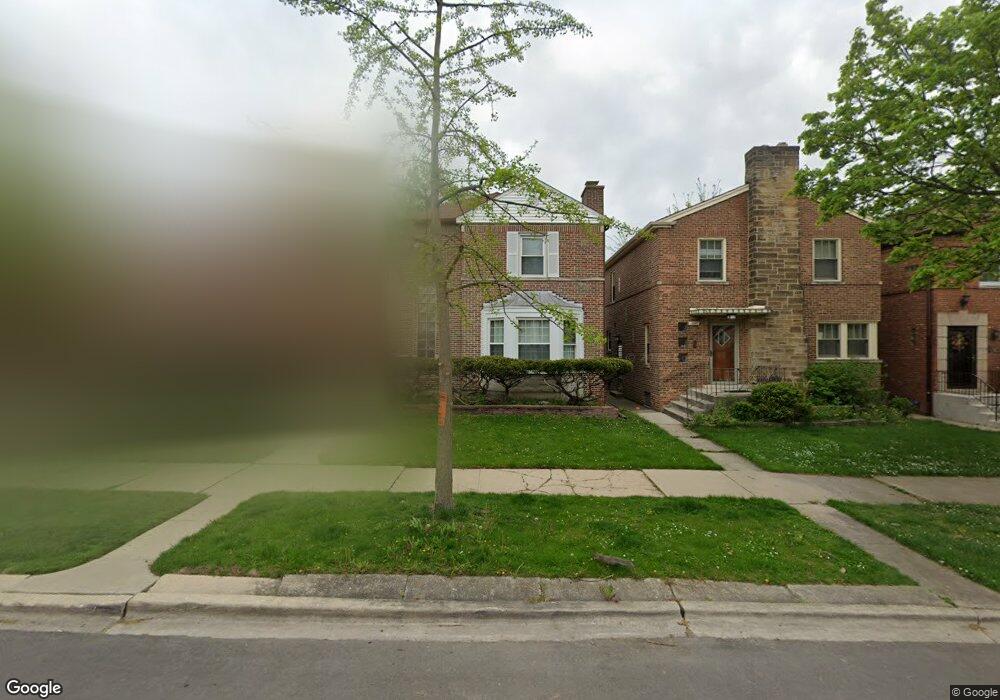
1851 N Rutherford Ave Chicago, IL 60707
Galewood NeighborhoodEstimated Value: $299,000 - $414,000
3
Beds
3
Baths
1,452
Sq Ft
$247/Sq Ft
Est. Value
About This Home
This home is located at 1851 N Rutherford Ave, Chicago, IL 60707 and is currently estimated at $359,114, approximately $247 per square foot. 1851 N Rutherford Ave is a home located in Cook County with nearby schools including Sayre Elementary Language Academy, Steinmetz College Prep, and Acero - Roberto Clemente Elementary School.
Ownership History
Date
Name
Owned For
Owner Type
Purchase Details
Closed on
Aug 15, 2017
Sold by
Camacho Alfredo and Camacho Marie A
Bought by
Catrambone Jennifer C
Current Estimated Value
Home Financials for this Owner
Home Financials are based on the most recent Mortgage that was taken out on this home.
Original Mortgage
$161,500
Outstanding Balance
$135,800
Interest Rate
4.25%
Mortgage Type
New Conventional
Estimated Equity
$223,314
Purchase Details
Closed on
Jun 10, 2003
Sold by
Pittman Delores and Pittman Slyvester
Bought by
Camacho Alfredo and Camacho Marie A
Purchase Details
Closed on
Aug 19, 1996
Sold by
American National Bk & Tr Co Of Chicago
Bought by
Pittman Slyvester and Pittman Delores
Home Financials for this Owner
Home Financials are based on the most recent Mortgage that was taken out on this home.
Original Mortgage
$152,337
Interest Rate
8.47%
Mortgage Type
VA
Create a Home Valuation Report for This Property
The Home Valuation Report is an in-depth analysis detailing your home's value as well as a comparison with similar homes in the area
Home Values in the Area
Average Home Value in this Area
Purchase History
| Date | Buyer | Sale Price | Title Company |
|---|---|---|---|
| Catrambone Jennifer C | $170,000 | First American Title | |
| Camacho Alfredo | $268,000 | Chicago Title Insurance Co | |
| Pittman Slyvester | $154,000 | -- |
Source: Public Records
Mortgage History
| Date | Status | Borrower | Loan Amount |
|---|---|---|---|
| Open | Catrambone Jennifer C | $161,500 | |
| Previous Owner | Pittman Slyvester | $152,337 |
Source: Public Records
Tax History Compared to Growth
Tax History
| Year | Tax Paid | Tax Assessment Tax Assessment Total Assessment is a certain percentage of the fair market value that is determined by local assessors to be the total taxable value of land and additions on the property. | Land | Improvement |
|---|---|---|---|---|
| 2024 | $5,278 | $34,000 | $11,718 | $22,282 |
| 2023 | $5,145 | $25,000 | $9,450 | $15,550 |
| 2022 | $5,145 | $25,000 | $9,450 | $15,550 |
| 2021 | $5,030 | $25,000 | $9,450 | $15,550 |
| 2020 | $5,666 | $25,421 | $4,725 | $20,696 |
| 2019 | $5,742 | $28,563 | $4,725 | $23,838 |
| 2018 | $5,645 | $28,563 | $4,725 | $23,838 |
| 2017 | $5,108 | $23,717 | $4,158 | $19,559 |
| 2016 | $4,753 | $23,717 | $4,158 | $19,559 |
| 2015 | $4,349 | $23,717 | $4,158 | $19,559 |
| 2014 | $3,141 | $21,319 | $3,780 | $17,539 |
| 2013 | $3,402 | $21,319 | $3,780 | $17,539 |
Source: Public Records
Map
Nearby Homes
- 1916 N Rutherford Ave
- 1937 N Normandy Ave
- 1733 N Oak Park Ave
- 1941 N New England Ave
- 1700 N Natoma Ave
- 2048 N Oak Park Ave
- 1709 N Newland Ave
- 1701 N Newland Ave
- 1600 N New England Ave Unit 4
- 1905 N Nordica Ave
- 1227 N East Ave
- 2044 N Narragansett Ave
- 7111 W Armitage Ave
- 1627 N Narragansett Ave
- 2218 N Newland Ave Unit 203
- 2328 N Normandy Ave
- 2054 N Nordica Ave
- 1221 Edmer Ave
- 1143 Woodbine Ave
- 1104 Fair Oaks Ave
- 1847 N Rutherford Ave
- 1853 N Rutherford Ave
- 1843 N Rutherford Ave
- 1859 N Rutherford Ave
- 1841 N Rutherford Ave
- 1837 N Rutherford Ave
- 1848 N Normandy Ave
- 1852 N Normandy Ave
- 1846 N Normandy Ave
- 1835 N Rutherford Ave
- 1854 N Normandy Ave
- 1842 N Normandy Ave
- 1858 N Normandy Ave
- 1840 N Normandy Ave
- 1831 N Rutherford Ave
- 1901 N Rutherford Ave
- 1836 N Normandy Ave
- 1846 N Rutherford Ave
- 1852 N Rutherford Ave
- 1844 N Rutherford Ave