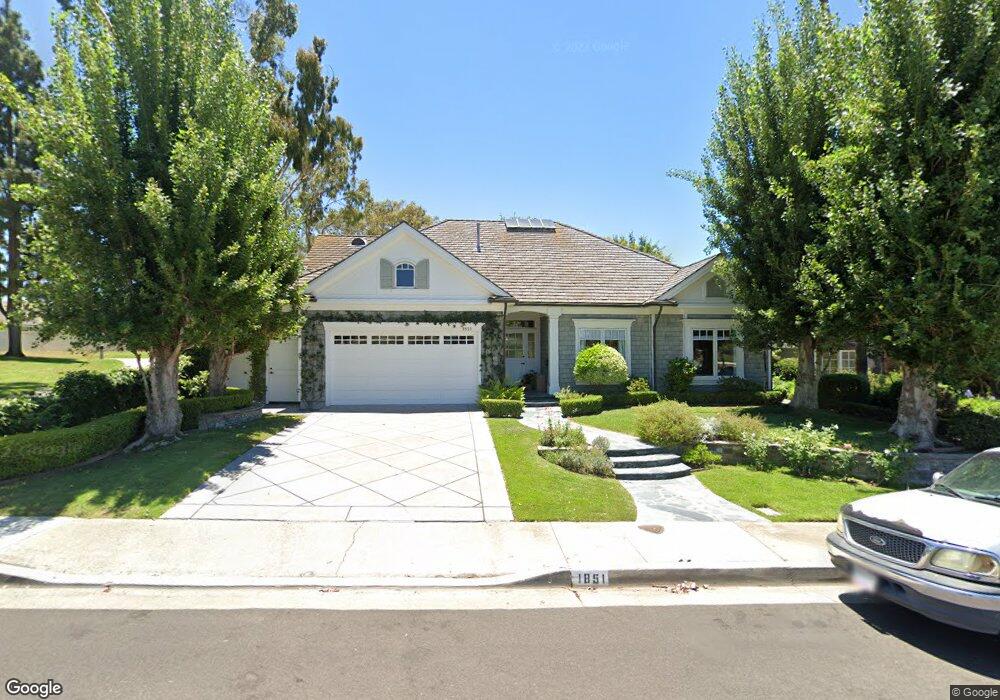
1851 Port Seabourne Way Newport Beach, CA 92660
Harbor View Homes NeighborhoodEstimated Value: $3,634,000 - $4,291,000
3
Beds
3
Baths
2,745
Sq Ft
$1,427/Sq Ft
Est. Value
About This Home
This home is located at 1851 Port Seabourne Way, Newport Beach, CA 92660 and is currently estimated at $3,916,022, approximately $1,426 per square foot. 1851 Port Seabourne Way is a home located in Orange County with nearby schools including Roy O. Andersen Elementary School, Corona del Mar Middle and High School, and Newport Christian School.
Ownership History
Date
Name
Owned For
Owner Type
Purchase Details
Closed on
Oct 14, 2004
Sold by
Kramer David B and Kramer Susan B
Bought by
Kramer David B and Kramer Susan B
Current Estimated Value
Purchase Details
Closed on
Mar 12, 2003
Sold by
Kramer David and Kramer Susan
Bought by
Kramer David B and Kramer Susan B
Home Financials for this Owner
Home Financials are based on the most recent Mortgage that was taken out on this home.
Original Mortgage
$900,000
Interest Rate
5.83%
Purchase Details
Closed on
Aug 30, 2001
Sold by
Kramer David and Kramer Susan
Bought by
Kramer David B and Kramer Susan B
Home Financials for this Owner
Home Financials are based on the most recent Mortgage that was taken out on this home.
Original Mortgage
$550,000
Interest Rate
7.05%
Purchase Details
Closed on
Jul 13, 2000
Sold by
Kramer David B and Kramer Susan B
Bought by
Kramer David B and Kramer Susan B
Create a Home Valuation Report for This Property
The Home Valuation Report is an in-depth analysis detailing your home's value as well as a comparison with similar homes in the area
Home Values in the Area
Average Home Value in this Area
Purchase History
| Date | Buyer | Sale Price | Title Company |
|---|---|---|---|
| Kramer David B | -- | -- | |
| Kramer David B | -- | North American Title Co | |
| Kramer David | -- | North American Title Co | |
| Kramer David B | -- | North American Title Co | |
| Kramer David | -- | North American Title Co | |
| Kramer David B | -- | -- | |
| Kramer David B | -- | -- |
Source: Public Records
Mortgage History
| Date | Status | Borrower | Loan Amount |
|---|---|---|---|
| Closed | Kramer David | $900,000 | |
| Closed | Kramer David | $550,000 |
Source: Public Records
Tax History Compared to Growth
Tax History
| Year | Tax Paid | Tax Assessment Tax Assessment Total Assessment is a certain percentage of the fair market value that is determined by local assessors to be the total taxable value of land and additions on the property. | Land | Improvement |
|---|---|---|---|---|
| 2025 | $7,706 | $715,984 | $293,979 | $422,005 |
| 2024 | $7,706 | $701,946 | $288,215 | $413,731 |
| 2023 | $7,521 | $688,183 | $282,564 | $405,619 |
| 2022 | $7,391 | $674,690 | $277,024 | $397,666 |
| 2021 | $7,250 | $661,461 | $271,592 | $389,869 |
| 2020 | $7,179 | $654,679 | $268,807 | $385,872 |
| 2019 | $7,034 | $641,843 | $263,537 | $378,306 |
| 2018 | $6,895 | $629,258 | $258,369 | $370,889 |
| 2017 | $6,773 | $616,920 | $253,303 | $363,617 |
| 2016 | $6,622 | $604,824 | $248,336 | $356,488 |
| 2015 | $6,557 | $595,739 | $244,605 | $351,134 |
| 2014 | $6,401 | $584,070 | $239,814 | $344,256 |
Source: Public Records
Map
Nearby Homes
- 1845 Port Westbourne Place
- 5 Hillsborough
- 1935 Port Bishop Place
- 17 Monaco Unit 12
- 1812 Port Margate Place
- 1977 Port Cardiff Place
- 1707 Newport Hills Dr W
- 1917 Yacht Colinia
- 29 Augusta Ln
- 2001 Yacht Resolute
- 1808 Newport Hills Dr E
- 15 Cypress Point Ln
- 11 Montpellier Unit 22
- 1736 Port Sheffield Place
- 31 Carmel Bay Dr
- 4 Summer House Ln
- 1 Cypress Point Ln
- 17 Napoli
- 56 Royal Saint George Rd
- 1 Rue du Parc
- 1845 Port Seabourne Way
- 1839 Port Seabourne Way
- 1854 Port Manleigh Place
- 1930 Port Claridge Place
- 1848 Port Manleigh Place
- 1833 Port Seabourne Way
- 1842 Port Manleigh Place
- 1931 Port Seabourne Way
- 1936 Port Claridge Place
- 1836 Port Manleigh Place
- 1827 Port Seabourne Way
- 1937 Port Seabourne Way
- 1942 Port Claridge Place
- 1830 Port Manleigh Place
- 1930 Port Seabourne Way
- 1931 Port Claridge Place
- 1855 Port Manleigh Place
- 1849 Port Manleigh Place
- 1943 Port Seabourne Way
- 1948 Port Claridge Place