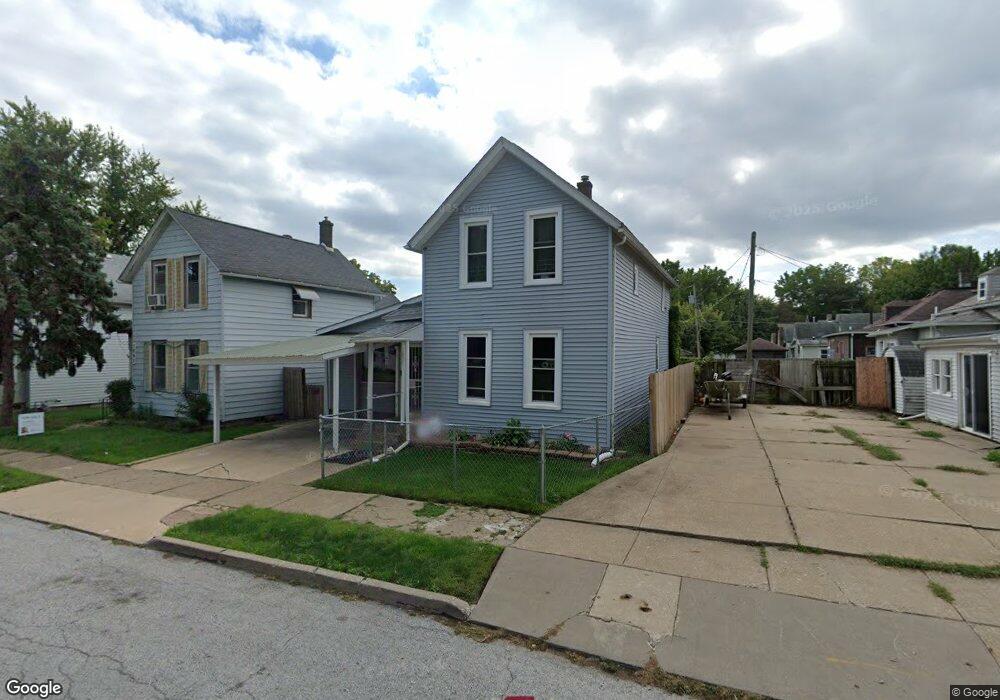
1851 W 7th St Davenport, IA 52802
Fejervary NeighborhoodEstimated Value: $111,000 - $125,056
3
Beds
2
Baths
1,786
Sq Ft
$67/Sq Ft
Est. Value
About This Home
This home is located at 1851 W 7th St, Davenport, IA 52802 and is currently estimated at $120,014, approximately $67 per square foot. 1851 W 7th St is a home located in Scott County with nearby schools including Walnut Hill Elementary School, South Christian Elementary School, and Wilson Elementary School.
Ownership History
Date
Name
Owned For
Owner Type
Purchase Details
Closed on
May 31, 2008
Sold by
Mai Lien and Pham Hoang
Bought by
Baugh Tyrrannie
Current Estimated Value
Home Financials for this Owner
Home Financials are based on the most recent Mortgage that was taken out on this home.
Original Mortgage
$61,534
Outstanding Balance
$39,071
Interest Rate
5.93%
Mortgage Type
Purchase Money Mortgage
Estimated Equity
$80,943
Create a Home Valuation Report for This Property
The Home Valuation Report is an in-depth analysis detailing your home's value as well as a comparison with similar homes in the area
Home Values in the Area
Average Home Value in this Area
Purchase History
| Date | Buyer | Sale Price | Title Company |
|---|---|---|---|
| Baugh Tyrrannie | $62,500 | None Available |
Source: Public Records
Mortgage History
| Date | Status | Borrower | Loan Amount |
|---|---|---|---|
| Open | Baugh Tyrrannie | $61,534 |
Source: Public Records
Tax History Compared to Growth
Tax History
| Year | Tax Paid | Tax Assessment Tax Assessment Total Assessment is a certain percentage of the fair market value that is determined by local assessors to be the total taxable value of land and additions on the property. | Land | Improvement |
|---|---|---|---|---|
| 2025 | $1,704 | $121,700 | $8,780 | $112,920 |
| 2024 | $2,610 | $105,570 | $8,780 | $96,790 |
| 2023 | $2,462 | $98,830 | $8,780 | $90,050 |
| 2022 | $2,401 | $82,670 | $6,240 | $76,430 |
| 2021 | $1,466 | $77,270 | $6,240 | $71,030 |
| 2020 | $2,191 | $77,270 | $6,240 | $71,030 |
| 2019 | $2,184 | $69,520 | $6,240 | $63,280 |
| 2018 | $1,997 | $69,520 | $6,240 | $63,280 |
| 2017 | $2,024 | $65,790 | $6,240 | $59,550 |
| 2016 | $1,909 | $65,790 | $0 | $0 |
| 2015 | $1,250 | $68,630 | $0 | $0 |
| 2014 | $1,330 | $68,630 | $0 | $0 |
| 2013 | $1,304 | $0 | $0 | $0 |
| 2012 | -- | $71,850 | $5,880 | $65,970 |
Source: Public Records
Map
Nearby Homes