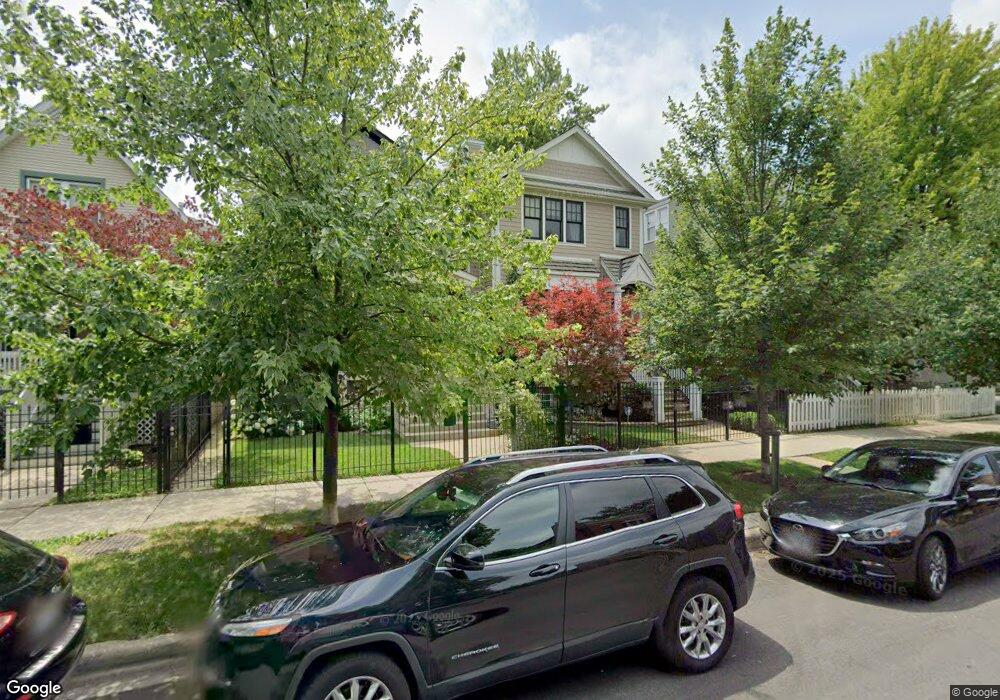
1851 W Barry Ave Unit 1 Chicago, IL 60657
Roscoe Village NeighborhoodEstimated Value: $1,699,000 - $2,246,000
4
Beds
5
Baths
2,853
Sq Ft
$679/Sq Ft
Est. Value
About This Home
This home is located at 1851 W Barry Ave Unit 1, Chicago, IL 60657 and is currently estimated at $1,937,550, approximately $679 per square foot. 1851 W Barry Ave Unit 1 is a home located in Cook County with nearby schools including Jahn School of Fine Arts, Lake View High School, and Saint Luke Academy.
Ownership History
Date
Name
Owned For
Owner Type
Purchase Details
Closed on
May 25, 2021
Sold by
Verceles Nicholas S and Verceles Brandi Anderson
Bought by
Casady Daniel and Casady Aubyn
Current Estimated Value
Home Financials for this Owner
Home Financials are based on the most recent Mortgage that was taken out on this home.
Original Mortgage
$1,184,000
Interest Rate
2.87%
Mortgage Type
New Conventional
Purchase Details
Closed on
Sep 1, 2017
Sold by
Savocchi Jared and Savocchi Carly
Bought by
Verceles Nicholas S and Verceles Brandi Anderson
Home Financials for this Owner
Home Financials are based on the most recent Mortgage that was taken out on this home.
Original Mortgage
$1,080,000
Interest Rate
3.25%
Mortgage Type
Adjustable Rate Mortgage/ARM
Purchase Details
Closed on
Feb 12, 2013
Sold by
Chicago Home Development Llc
Bought by
Savocchi Jared and Savocchi Carly
Purchase Details
Closed on
Jan 18, 2012
Sold by
Atg Trust Company
Bought by
Chicago Home Development Llc
Purchase Details
Closed on
Jul 18, 2011
Sold by
Hendry John
Bought by
Atg Trust Company and Trust #L011-133
Create a Home Valuation Report for This Property
The Home Valuation Report is an in-depth analysis detailing your home's value as well as a comparison with similar homes in the area
Home Values in the Area
Average Home Value in this Area
Purchase History
| Date | Buyer | Sale Price | Title Company |
|---|---|---|---|
| Casady Daniel | $1,500,000 | Attorney | |
| Verceles Nicholas S | $1,350,000 | Proper Title Llc | |
| Savocchi Jared | $1,255,000 | 1St American Title | |
| Chicago Home Development Llc | $350,000 | First American Title | |
| Atg Trust Company | -- | None Available |
Source: Public Records
Mortgage History
| Date | Status | Borrower | Loan Amount |
|---|---|---|---|
| Previous Owner | Casady Daniel | $1,184,000 | |
| Previous Owner | Verceles Nicholas S | $1,080,000 |
Source: Public Records
Tax History Compared to Growth
Tax History
| Year | Tax Paid | Tax Assessment Tax Assessment Total Assessment is a certain percentage of the fair market value that is determined by local assessors to be the total taxable value of land and additions on the property. | Land | Improvement |
|---|---|---|---|---|
| 2024 | $28,061 | $150,001 | $48,438 | $101,563 |
| 2023 | $27,356 | $133,001 | $39,063 | $93,938 |
| 2022 | $27,356 | $133,001 | $39,063 | $93,938 |
| 2021 | $26,745 | $132,999 | $39,062 | $93,937 |
| 2020 | $28,901 | $129,737 | $17,500 | $112,237 |
| 2019 | $28,332 | $141,019 | $17,500 | $123,519 |
| 2018 | $27,856 | $141,019 | $17,500 | $123,519 |
| 2017 | $24,853 | $115,451 | $15,625 | $99,826 |
| 2016 | $23,124 | $115,451 | $15,625 | $99,826 |
| 2015 | $21,156 | $115,451 | $15,625 | $99,826 |
| 2014 | $23,924 | $128,945 | $12,500 | $116,445 |
| 2013 | $15,616 | $85,860 | $12,500 | $73,360 |
Source: Public Records
Map
Nearby Homes
- 1935 W Belmont Ave Unit 2
- 1938 W Belmont Ave Unit 2
- 3201 N Ravenswood Ave Unit 301
- 1732 W Fletcher St
- 1738 W Belmont Ave Unit 1R
- 1955 W Melrose St Unit 2
- 2020 W Barry Ave
- 2011 W Belmont Ave Unit 208
- 3009 N Damen Ave Unit 2
- 1712 W Fletcher St
- 2027 W Belmont Ave Unit 1
- 1759 W Wellington Ave
- 2043 W Belmont Ave Unit 3
- 3117 N Paulina St Unit G
- 3137 N Hoyne Ave
- 2034 W Melrose St
- 1753 W Henderson St
- 2903 N Wolcott Ave Unit A
- 3040 N Hoyne Ave
- 3255 N Paulina St Unit 2B
- 1851 W Barry Ave
- 1849 W Barry Ave
- 1853 W Barry Ave Unit 1
- 1845 W Barry Ave
- 1843 W Barry Ave
- 1841 W Barry Ave
- 1839 W Barry Ave
- 3050 N Wolcott Ave Unit CH
- 1901 W Barry Ave Unit 2
- 1901 W Barry Ave Unit 1
- 1901 W Barry Ave
- 1901 W Barry Ave
- 1850 W Nelson St
- 1846 W Nelson St
- 1852 W Nelson St
- 1835 W Barry Ave
- 1835 W Barry Ave
- 1844 W Nelson St
- 1903 W Barry Ave Unit 1
- 1903 W Barry Ave