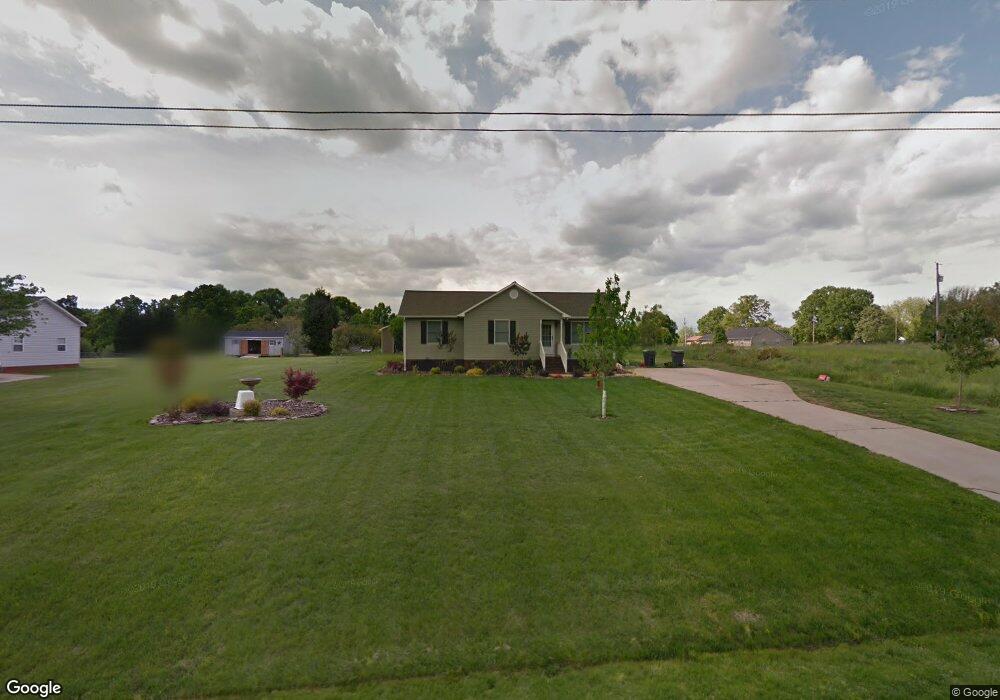
1851 Will Schronce Rd Lincolnton, NC 28092
Estimated Value: $283,000 - $298,000
3
Beds
2
Baths
1,168
Sq Ft
$247/Sq Ft
Est. Value
About This Home
This home is located at 1851 Will Schronce Rd, Lincolnton, NC 28092 and is currently estimated at $288,760, approximately $247 per square foot. 1851 Will Schronce Rd is a home located in Lincoln County with nearby schools including G.E. Massey Elementary School, Lincolnton Middle School, and Lincolnton High School.
Ownership History
Date
Name
Owned For
Owner Type
Purchase Details
Closed on
Dec 1, 2020
Sold by
Floyd Glen A and Floyd Caitlin Andrews
Bought by
Sides Heather and Sides Michael
Current Estimated Value
Home Financials for this Owner
Home Financials are based on the most recent Mortgage that was taken out on this home.
Original Mortgage
$189,150
Outstanding Balance
$168,317
Interest Rate
2.8%
Mortgage Type
New Conventional
Estimated Equity
$120,443
Purchase Details
Closed on
May 1, 2006
Sold by
Trent Brian D and Trent Frank G
Bought by
Floyd Glen A
Home Financials for this Owner
Home Financials are based on the most recent Mortgage that was taken out on this home.
Original Mortgage
$94,897
Interest Rate
6.39%
Mortgage Type
New Conventional
Purchase Details
Closed on
Sep 3, 1996
Bought by
Trent Corenia M
Create a Home Valuation Report for This Property
The Home Valuation Report is an in-depth analysis detailing your home's value as well as a comparison with similar homes in the area
Home Values in the Area
Average Home Value in this Area
Purchase History
| Date | Buyer | Sale Price | Title Company |
|---|---|---|---|
| Sides Heather | $195,000 | Austin Title Llc | |
| Floyd Glen A | $93,000 | None Available | |
| Trent Corenia M | $67,300 | -- |
Source: Public Records
Mortgage History
| Date | Status | Borrower | Loan Amount |
|---|---|---|---|
| Open | Sides Heather | $189,150 | |
| Previous Owner | Floyd Glen A | $94,897 |
Source: Public Records
Tax History Compared to Growth
Tax History
| Year | Tax Paid | Tax Assessment Tax Assessment Total Assessment is a certain percentage of the fair market value that is determined by local assessors to be the total taxable value of land and additions on the property. | Land | Improvement |
|---|---|---|---|---|
| 2025 | $1,401 | $202,082 | $28,357 | $173,725 |
| 2024 | $1,381 | $202,082 | $28,357 | $173,725 |
| 2023 | $1,376 | $202,082 | $28,357 | $173,725 |
| 2022 | $1,032 | $123,269 | $23,479 | $99,790 |
| 2021 | $1,032 | $123,269 | $23,479 | $99,790 |
| 2020 | $892 | $123,269 | $23,479 | $99,790 |
| 2019 | $892 | $123,269 | $23,479 | $99,790 |
| 2018 | $927 | $111,332 | $21,199 | $90,133 |
| 2017 | $819 | $111,332 | $21,199 | $90,133 |
| 2016 | $729 | $0 | $21,199 | $77,897 |
| 2015 | $954 | $118,429 | $21,199 | $97,230 |
| 2014 | $806 | $105,026 | $21,199 | $83,827 |
Source: Public Records
Map
Nearby Homes
- 2651 Keever Dairy Farm Rd
- 1987 & 1981 Magnolia Grove Rd
- 1341 Mirror Lake Rd
- 2452 Salem Church Rd
- 1585 Salem Church Rd
- 864 Calloway Rd
- 1554 Forum Ln
- 1743 Autumn Banks Way Unit 73p
- 1747 Autumn Banks Way Unit 75p
- 1753 Autumn Banks Way Unit 76p
- 1755 Autumn Banks Way Unit 77p
- 3132 Fox Den Cir
- 1481 Depot St
- 1532 Autumn Banks Way Unit 102
- 325 Holly Ridge Rd
- 1509 Autumn Banks Way Unit 74p
- 1212 Salem Church Rd
- 1512 Autumn Banks Way Unit 113
- 1512 Autumn Banks Way
- 3483 Broad River Ln
- 1851 Will Schronce Rd Unit 5
- 1839 Will Schronce Rd
- 1827 Will Schronce Rd
- 2638 Keever Dairy Farm Rd
- 2662 Keever Dairy Farm Rd
- 2614 Keever Dairy Farm Rd
- 2602 Keever Dairy Farm Rd
- 1793 Will Schronce Rd
- 0000 Keever Dairy Farm Rd
- 2639 Keever Dairy Farm Rd
- - Keever Dairy Farm Rd
- 2621 Keever Dairy Farm Rd
- 2600 Keever Dairy Farm Rd
- 1781 Will Schronce Rd
- 2601 Keever Dairy Farm Rd
- 2758 Keever Dairy Farm Rd
- 2585 Keever Dairy Farm Rd
- 2023 Will Schronce Rd
- 2020 Will Schronce Rd
- Approx 11. Keever Dairy Farm Rd