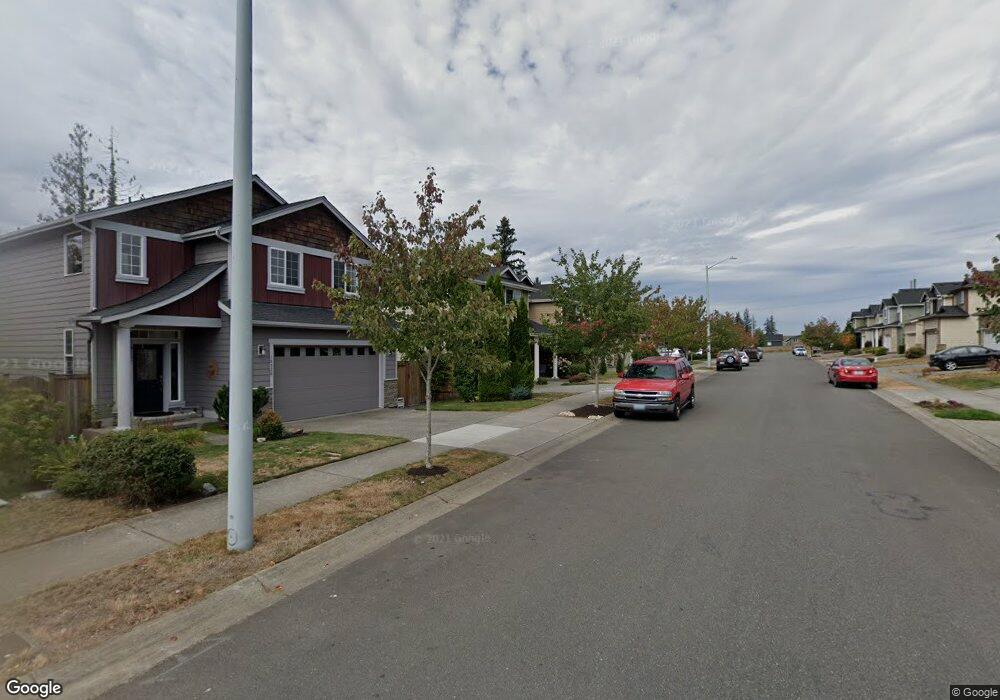
18518 41st Dr SE Unit Lt10 Bothell, WA 98012
North Creek NeighborhoodEstimated Value: $1,112,000 - $1,245,000
4
Beds
3
Baths
2,541
Sq Ft
$463/Sq Ft
Est. Value
About This Home
This home is located at 18518 41st Dr SE Unit Lt10, Bothell, WA 98012 and is currently estimated at $1,176,789, approximately $463 per square foot. 18518 41st Dr SE Unit Lt10 is a home located in Snohomish County with nearby schools including Fernwood Elementary School, Skyview Middle School, and North Creek High School.
Ownership History
Date
Name
Owned For
Owner Type
Purchase Details
Closed on
Jul 21, 2015
Sold by
Shin Hyungsuk
Bought by
Maya Rajasekharan Rajesh and Maya Chitra
Current Estimated Value
Home Financials for this Owner
Home Financials are based on the most recent Mortgage that was taken out on this home.
Original Mortgage
$356,000
Outstanding Balance
$272,569
Interest Rate
3.75%
Mortgage Type
Adjustable Rate Mortgage/ARM
Estimated Equity
$904,220
Purchase Details
Closed on
Aug 31, 2009
Sold by
C S Inc
Bought by
Shin Hyungsuk
Home Financials for this Owner
Home Financials are based on the most recent Mortgage that was taken out on this home.
Original Mortgage
$353,429
Interest Rate
5.19%
Mortgage Type
FHA
Purchase Details
Closed on
Aug 24, 2009
Sold by
Yu Seung Hee
Bought by
Shin Hyungsuk
Home Financials for this Owner
Home Financials are based on the most recent Mortgage that was taken out on this home.
Original Mortgage
$353,429
Interest Rate
5.19%
Mortgage Type
FHA
Create a Home Valuation Report for This Property
The Home Valuation Report is an in-depth analysis detailing your home's value as well as a comparison with similar homes in the area
Home Values in the Area
Average Home Value in this Area
Purchase History
| Date | Buyer | Sale Price | Title Company |
|---|---|---|---|
| Maya Rajasekharan Rajesh | $445,000 | Ticor Title | |
| Maya Rajasekharan Rajesh | $445,000 | Ticor Title | |
| Shin Hyungsuk | $359,950 | Pnwt | |
| Shin Hyungsuk | $359,950 | Pnwt | |
| Shin Hyungsuk | -- | Pnwt | |
| Shin Hyungsuk | -- | Pnwt |
Source: Public Records
Mortgage History
| Date | Status | Borrower | Loan Amount |
|---|---|---|---|
| Open | Maya Rajasekharan Rajesh | $356,000 | |
| Previous Owner | Shin Hyungsuk | $353,429 |
Source: Public Records
Tax History
| Year | Tax Paid | Tax Assessment Tax Assessment Total Assessment is a certain percentage of the fair market value that is determined by local assessors to be the total taxable value of land and additions on the property. | Land | Improvement |
|---|---|---|---|---|
| 2026 | $9,297 | $1,225,400 | $860,100 | $365,300 |
| 2025 | $8,448 | $1,056,700 | $705,600 | $351,100 |
| 2024 | $8,448 | $960,000 | $621,100 | $338,900 |
| 2023 | $8,661 | $1,098,800 | $708,900 | $389,900 |
| 2022 | $7,445 | $749,200 | $418,200 | $331,000 |
| 2020 | $6,747 | $640,700 | $338,000 | $302,700 |
| 2019 | $6,185 | $594,700 | $295,000 | $299,700 |
| 2018 | $5,779 | $517,400 | $250,000 | $267,400 |
| 2017 | $5,002 | $456,500 | $205,000 | $251,500 |
| 2016 | $4,938 | $430,000 | $165,000 | $265,000 |
| 2015 | $4,686 | $387,300 | $150,000 | $237,300 |
| 2013 | $4,186 | $307,500 | $142,000 | $165,500 |
Source: Public Records
Map
Nearby Homes
- 4319 186th Place SE
- 4329 186th Place SE
- 18717 43rd Dr SE
- 18726 43rd Dr SE
- 18214 41st Ave SE
- 18616 45th Dr SE
- 18521 46th Ave SE
- 18615 46th Ave SE
- 18725 35th Dr SE
- 17913 38th Dr SE Unit 20
- 17817 41st Dr SE
- 3933 178th Place SE
- 18612 51st Ave SE
- 4117 177th Place SE
- 3413 189th Place SE
- 3621 192nd St SE Unit C
- 18115 34th Dr SE
- 3732 194th SE
- 3918 177th St SE
- 3809 194th Ln SE
- 18518 41st Dr SE
- 18510 41st Dr SE Unit Lt 9
- 18510 41st Dr SE
- 18524 41st Dr SE
- 18506 41st Dr SE
- 18528 41st Dr SE
- 18500 41st Dr SE
- 18517 41st Dr SE
- 18532 41st Dr SE
- 18521 41st Dr SE
- 18432 41st Dr SE
- 18507 41st Dr SE
- 18503 41st Dr SE
- 18529 41st Dr SE
- 18428 41st Dr SE Unit Lt 5
- 18428 41st Dr SE
- 18604 41st Dr SE
- 18431 41st Dr SE
- 18530 41st Ave SE Unit Lt 27
- 18516 42nd Ave SE
Your Personal Tour Guide
Ask me questions while you tour the home.