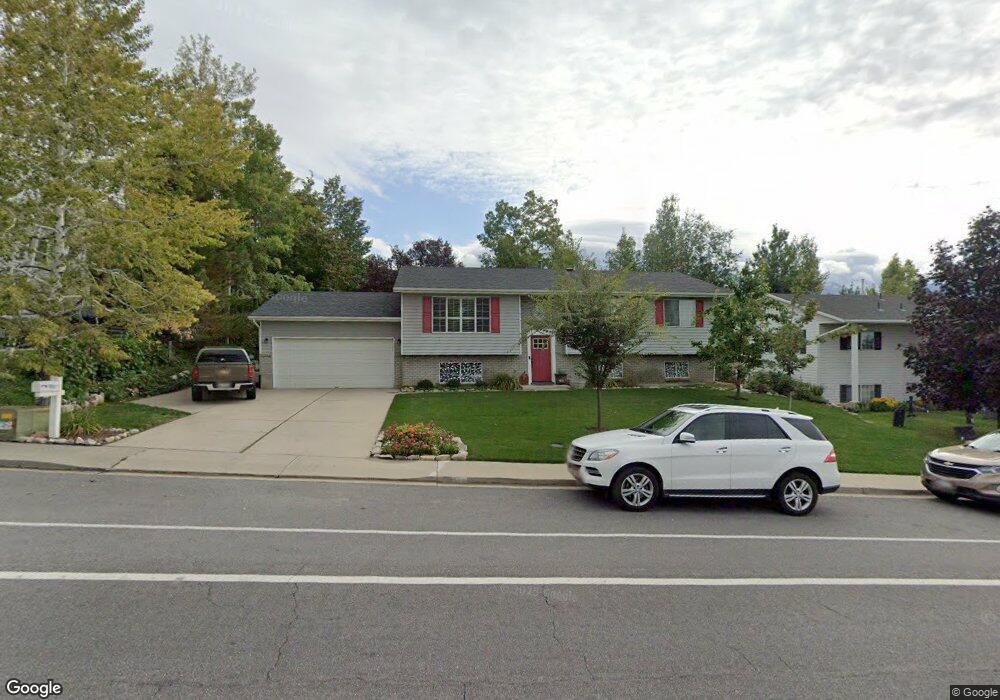
1852 N 400 E Orem, UT 84097
Northridge NeighborhoodEstimated Value: $560,000 - $598,053
5
Beds
3
Baths
2,682
Sq Ft
$217/Sq Ft
Est. Value
About This Home
This home is located at 1852 N 400 E, Orem, UT 84097 and is currently estimated at $582,351, approximately $217 per square foot. 1852 N 400 E is a home located in Utah County with nearby schools including Northridge Elementary School, Oak Canyon Junior High School, and Timpanogos High School.
Ownership History
Date
Name
Owned For
Owner Type
Purchase Details
Closed on
Aug 28, 2018
Sold by
Fleming Marcus N and Fleming Rebecca
Bought by
Willard Justin D and Willard Rebecca L
Current Estimated Value
Home Financials for this Owner
Home Financials are based on the most recent Mortgage that was taken out on this home.
Original Mortgage
$367,038
Outstanding Balance
$318,758
Interest Rate
4.5%
Mortgage Type
VA
Estimated Equity
$263,593
Purchase Details
Closed on
Feb 18, 2015
Sold by
Fleming Marcus N
Bought by
Fleming Marcus N and Fleming Rbecca
Home Financials for this Owner
Home Financials are based on the most recent Mortgage that was taken out on this home.
Original Mortgage
$250,267
Interest Rate
3.57%
Mortgage Type
VA
Purchase Details
Closed on
Apr 26, 2012
Sold by
Harper Brent L and Harper Arlene
Bought by
Harper Brent L
Home Financials for this Owner
Home Financials are based on the most recent Mortgage that was taken out on this home.
Original Mortgage
$92,000
Interest Rate
3.9%
Mortgage Type
Purchase Money Mortgage
Create a Home Valuation Report for This Property
The Home Valuation Report is an in-depth analysis detailing your home's value as well as a comparison with similar homes in the area
Home Values in the Area
Average Home Value in this Area
Purchase History
| Date | Buyer | Sale Price | Title Company |
|---|---|---|---|
| Willard Justin D | -- | Meridian Title Co | |
| Fleming Marcus N | -- | Access Title Co | |
| Fleming Marens N | -- | Backman Title Services Ltd | |
| Harper Brent L | -- | Inwest Title Services Inc |
Source: Public Records
Mortgage History
| Date | Status | Borrower | Loan Amount |
|---|---|---|---|
| Open | Willard Justin D | $367,038 | |
| Previous Owner | Fleming Marens N | $250,267 | |
| Previous Owner | Harper Brent L | $92,000 |
Source: Public Records
Tax History
| Year | Tax Paid | Tax Assessment Tax Assessment Total Assessment is a certain percentage of the fair market value that is determined by local assessors to be the total taxable value of land and additions on the property. | Land | Improvement |
|---|---|---|---|---|
| 2025 | $2,372 | $309,925 | -- | -- |
| 2024 | $2,372 | $290,015 | $0 | $0 |
| 2023 | $2,202 | $289,355 | $0 | $0 |
| 2022 | $2,220 | $282,700 | $0 | $0 |
| 2021 | $1,967 | $379,400 | $153,500 | $225,900 |
| 2020 | $1,817 | $344,300 | $122,800 | $221,500 |
| 2019 | $1,714 | $337,800 | $122,800 | $215,000 |
| 2018 | $1,686 | $317,500 | $115,800 | $201,700 |
| 2017 | $1,442 | $145,420 | $0 | $0 |
| 2016 | $1,372 | $127,600 | $0 | $0 |
| 2015 | $1,307 | $115,005 | $0 | $0 |
| 2014 | $1,201 | $105,160 | $0 | $0 |
Source: Public Records
Map
Nearby Homes
- 540 E Quail Rd
- 1636 N 160 E
- 1638 N 160 E
- 110 S 1320 E
- 1480 N 430 E
- 695 E 1870 N
- 363 E 1395 N Unit 22
- 49 W 1880 N
- 1643 N Mountain Oaks Dr
- 1371 N 330 E Unit 8
- 723 E 1450 N Unit 25
- 14 N 850 E
- 713 E 1500 St N Unit 19
- 1051 E 100 N
- 713 E 1450 N Unit 23
- 747 E 1500 N Unit 13
- 120 N 950 E
- 1366 N 750 E
- 733 E 1450 N Unit 5
- 1356 N 750 E Unit 11
- 1864 N 400 E
- 1842 N 400 E
- 1855 Heather Dr
- 1843 Heather Dr
- 1843 N Heather Dr
- 1867 Heather Dr
- 1867 Heather Dr Unit 23
- 1849 N 400 E
- 1874 N 400 E
- 405 Heather Rd
- 1861 N 400 E
- 1837 N 400 E
- 409 Heather Rd
- 1873 N 400 E
- 1823 N 400 E
- 1831 Heather Dr
- 1856 Heather Dr
- 1879 Heather Dr
- 1886 N 400 E
- 326 Heather Cir
Your Personal Tour Guide
Ask me questions while you tour the home.