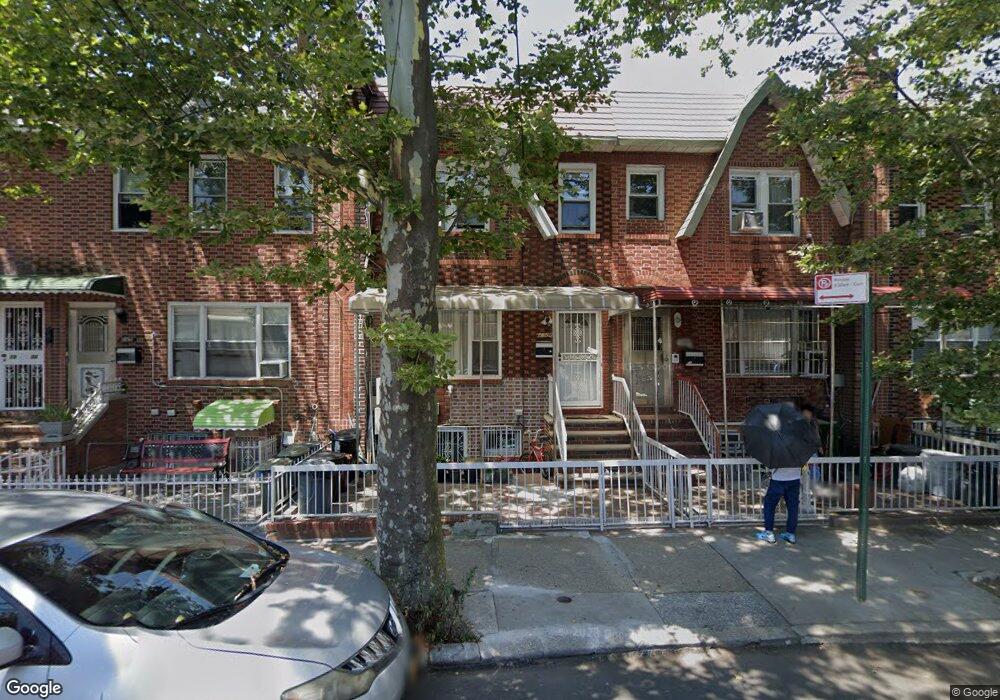
1852 W 7th St Brooklyn, NY 11223
Gravesend NeighborhoodEstimated Value: $974,000 - $1,154,000
Studio
--
Bath
1,728
Sq Ft
$611/Sq Ft
Est. Value
About This Home
This home is located at 1852 W 7th St, Brooklyn, NY 11223 and is currently estimated at $1,056,459, approximately $611 per square foot. 1852 W 7th St is a home located in Kings County with nearby schools including P.S. 97 - The Highlawn, Is 228 David A Boody, and Hebrew Language Academy Charter 2.
Ownership History
Date
Name
Owned For
Owner Type
Purchase Details
Closed on
Apr 24, 2020
Sold by
Wu Shouyan and Xie Kevin
Bought by
Wu Shouyan and Xie Weimou
Current Estimated Value
Purchase Details
Closed on
Nov 6, 2015
Sold by
Mak Chi Chui
Bought by
Wu Shouyan and Xie Kevin
Home Financials for this Owner
Home Financials are based on the most recent Mortgage that was taken out on this home.
Original Mortgage
$280,000
Interest Rate
3.79%
Mortgage Type
New Conventional
Purchase Details
Closed on
Jan 11, 2008
Sold by
Mak Chi Chui and Mak Yiu Wing
Bought by
Mak Chi Chui
Purchase Details
Closed on
Oct 11, 2006
Sold by
Tze Mak and Tze Hing Chan
Bought by
Mak Chi Chui and Mak Yiu Wing
Purchase Details
Closed on
Feb 14, 1996
Sold by
Scarcella Frances
Bought by
Mak Yiu Wing and Mak Tze Hing Chan
Home Financials for this Owner
Home Financials are based on the most recent Mortgage that was taken out on this home.
Original Mortgage
$96,000
Interest Rate
7.04%
Create a Home Valuation Report for This Property
The Home Valuation Report is an in-depth analysis detailing your home's value as well as a comparison with similar homes in the area
Home Values in the Area
Average Home Value in this Area
Purchase History
| Date | Buyer | Sale Price | Title Company |
|---|---|---|---|
| Wu Shouyan | -- | -- | |
| Wu Shouyan | -- | -- | |
| Wu Shouyan | -- | -- | |
| Wu Shouyan | $677,000 | -- | |
| Wu Shouyan | $677,000 | -- | |
| Wu Shouyan | $677,000 | -- | |
| Mak Chi Chui | -- | -- | |
| Mak Chi Chui | -- | -- | |
| Mak Chi Chui | -- | -- | |
| Mak Chi Chui | -- | -- | |
| Mak Yiu Wing | $146,000 | -- | |
| Mak Yiu Wing | $146,000 | -- |
Source: Public Records
Mortgage History
| Date | Status | Borrower | Loan Amount |
|---|---|---|---|
| Previous Owner | Wu Shouyan | $280,000 | |
| Previous Owner | Mak Yiu Wing | $96,000 |
Source: Public Records
Tax History
| Year | Tax Paid | Tax Assessment Tax Assessment Total Assessment is a certain percentage of the fair market value that is determined by local assessors to be the total taxable value of land and additions on the property. | Land | Improvement |
|---|---|---|---|---|
| 2025 | $6,304 | $68,100 | $7,320 | $60,780 |
| 2024 | $6,304 | $61,920 | $7,320 | $54,600 |
| 2023 | $6,025 | $62,580 | $7,320 | $55,260 |
| 2022 | $5,664 | $65,280 | $7,320 | $57,960 |
| 2021 | $5,971 | $59,460 | $7,320 | $52,140 |
| 2020 | $2,895 | $47,880 | $7,320 | $40,560 |
| 2019 | $5,471 | $47,880 | $7,320 | $40,560 |
| 2018 | $5,039 | $24,721 | $4,422 | $20,299 |
| 2017 | $4,820 | $23,644 | $4,144 | $19,500 |
| 2016 | $4,727 | $23,644 | $4,486 | $19,158 |
| 2015 | $2,471 | $23,064 | $6,590 | $16,474 |
| 2014 | $2,471 | $21,795 | $7,466 | $14,329 |
Source: Public Records
Map
Nearby Homes
- 1854 W 7th St
- 1841 W 8th St
- 1864 W 6th St
- 1880 W 6th St
- 1888 W 6th St
- 1847 W 9th St Unit Townhouse
- 172 Highlawn Ave
- 1801 W 8th St
- 204 Highlawn Ave
- 97 Avenue S
- 104 Highlawn Ave
- 1944 W 8th St
- 1932 W 9th St
- 1951A W 9th St
- 314 Kings Hwy
- 290 Kings Hwy
- 1739 W 9th St
- 284 Kings Hwy
- 1961 W 10th St
- 332 Kings Hwy
Your Personal Tour Guide
Ask me questions while you tour the home.