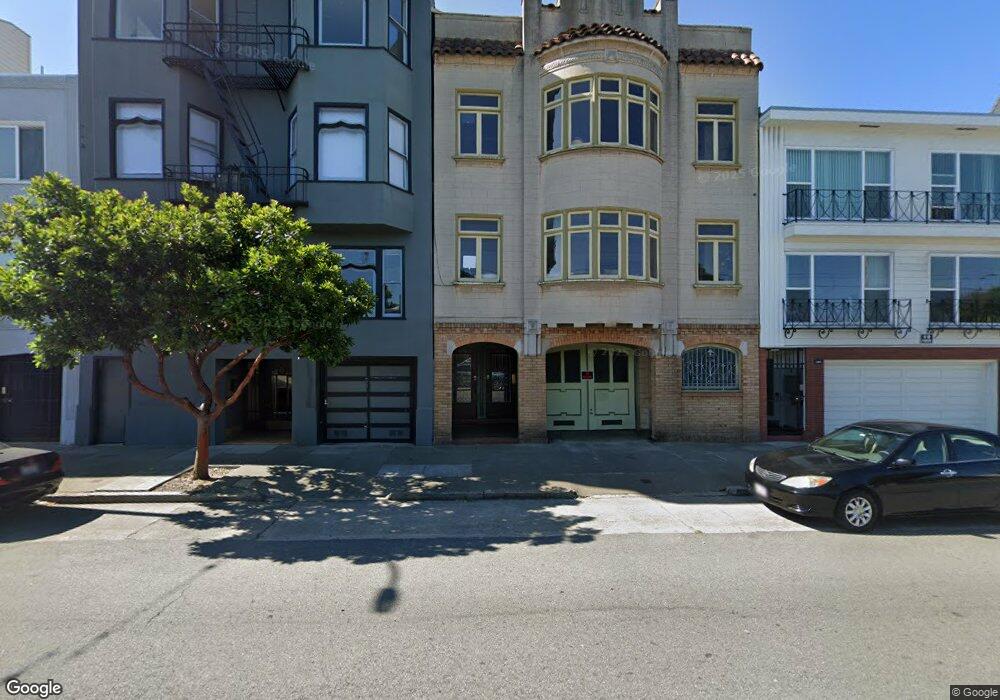
1853 Chestnut St Unit 1855 San Francisco, CA 94123
Marina District NeighborhoodEstimated Value: $3,101,000 - $3,455,006
--
Bed
3
Baths
4,656
Sq Ft
$711/Sq Ft
Est. Value
About This Home
This home is located at 1853 Chestnut St Unit 1855, San Francisco, CA 94123 and is currently estimated at $3,309,752, approximately $710 per square foot. 1853 Chestnut St Unit 1855 is a home located in San Francisco County with nearby schools including Sherman Elementary, Marina Middle School, and Mary L. Booker Leadership Academy.
Create a Home Valuation Report for This Property
The Home Valuation Report is an in-depth analysis detailing your home's value as well as a comparison with similar homes in the area
Home Values in the Area
Average Home Value in this Area
Tax History Compared to Growth
Tax History
| Year | Tax Paid | Tax Assessment Tax Assessment Total Assessment is a certain percentage of the fair market value that is determined by local assessors to be the total taxable value of land and additions on the property. | Land | Improvement |
|---|---|---|---|---|
| 2025 | $10,520 | $828,680 | $435,062 | $393,618 |
| 2024 | $10,520 | $812,432 | $426,532 | $385,900 |
| 2023 | $10,266 | $796,504 | $418,170 | $378,334 |
| 2022 | $10,049 | $780,888 | $409,972 | $370,916 |
| 2021 | $9,871 | $765,578 | $401,934 | $363,644 |
| 2020 | $10,025 | $757,730 | $397,814 | $359,916 |
| 2019 | $9,691 | $742,874 | $390,014 | $352,860 |
| 2018 | $9,363 | $728,310 | $382,368 | $345,942 |
| 2017 | $8,956 | $714,032 | $374,872 | $339,160 |
| 2016 | $8,791 | $700,032 | $367,522 | $332,510 |
| 2015 | $8,678 | $689,518 | $362,002 | $327,516 |
| 2014 | $8,453 | $676,014 | $354,912 | $321,102 |
Source: Public Records
Map
Nearby Homes
- 115 Magnolia St
- 1734 Bay St Unit 106
- 3110 Buchanan St
- 3537-3539 Fillmore St
- 1864 Greenwich St
- 32 Harris Place Unit A
- 1500 Francisco St Unit 1
- 3675 Fillmore St Unit 302
- 3208 Pierce St Unit 406
- 1468 Francisco St Unit 1
- 2100 Green St Unit 206
- 1630 Lombard St
- 1755 Filbert St Unit 1
- 2160 Vallejo St
- 2916 Gough St
- 135 Avila St
- 1671 Greenwich St
- 115 Retiro Way
- 1998 Vallejo St Unit 2
- 1776 Green St Unit 201
- 1849 Chestnut St
- 1849 Chestnut St Unit 5
- 1849 Chestnut St Unit 6
- 1849 Chestnut St Unit 2
- 1849 Chestnut St Unit 3
- 150 Magnolia St
- 1865 Chestnut St
- 1831 Chestnut St Unit 1833
- 116 Magnolia St Unit 118
- 1871 Chestnut St Unit 1873
- 1825 Chestnut St Unit 1827
- 1877 Chestnut St Unit 1879
- 145 Magnolia St
- 1817 Chestnut St
- 1815 Chestnut St
- 3349 Buchanan St Unit 3353
- 3343 Buchanan St Unit 3345
- 3337 Buchanan St Unit 3339
- 1950 Lombard St
- 1958 Lombard St