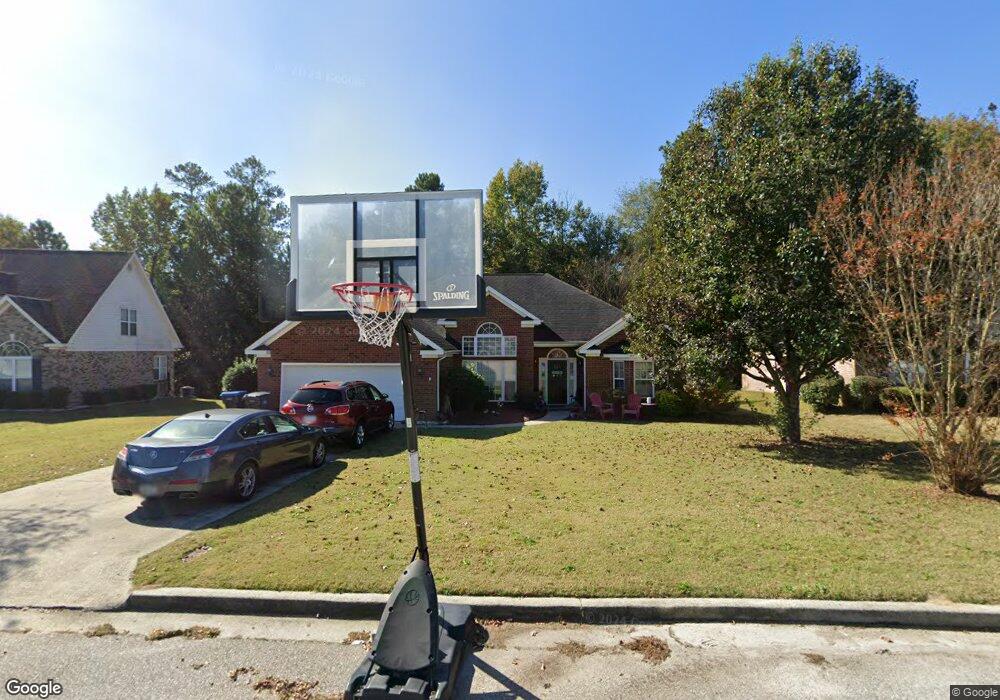
1853 Heathers Way Augusta, GA 30906
Goshen NeighborhoodEstimated Value: $256,442 - $280,000
4
Beds
2
Baths
2,034
Sq Ft
$133/Sq Ft
Est. Value
About This Home
This home is located at 1853 Heathers Way, Augusta, GA 30906 and is currently estimated at $270,611, approximately $133 per square foot. 1853 Heathers Way is a home located in Richmond County with nearby schools including Gracewood Elementary School, Pine Hill Middle School, and Johnson Magnet.
Ownership History
Date
Name
Owned For
Owner Type
Purchase Details
Closed on
Jul 18, 2005
Sold by
Sturm Stephen N and Sturm Kaye T
Bought by
Jones Gorjis
Current Estimated Value
Home Financials for this Owner
Home Financials are based on the most recent Mortgage that was taken out on this home.
Original Mortgage
$168,445
Outstanding Balance
$86,234
Interest Rate
5.46%
Mortgage Type
VA
Estimated Equity
$184,377
Purchase Details
Closed on
Jun 3, 2002
Sold by
Hall Joe and Joe Hall Home Improvements
Bought by
Sturm Stephen N and Sturm Kaye T
Home Financials for this Owner
Home Financials are based on the most recent Mortgage that was taken out on this home.
Original Mortgage
$108,720
Interest Rate
6.85%
Purchase Details
Closed on
May 31, 2002
Sold by
Mulkey Jimmy
Bought by
Hall Joe and Joe Hall Home Improvements
Home Financials for this Owner
Home Financials are based on the most recent Mortgage that was taken out on this home.
Original Mortgage
$108,720
Interest Rate
6.85%
Create a Home Valuation Report for This Property
The Home Valuation Report is an in-depth analysis detailing your home's value as well as a comparison with similar homes in the area
Home Values in the Area
Average Home Value in this Area
Purchase History
| Date | Buyer | Sale Price | Title Company |
|---|---|---|---|
| Jones Gorjis | $164,900 | -- | |
| Sturm Stephen N | $135,900 | -- | |
| Hall Joe | -- | -- |
Source: Public Records
Mortgage History
| Date | Status | Borrower | Loan Amount |
|---|---|---|---|
| Open | Jones Gorjis | $168,445 | |
| Previous Owner | Sturm Stephen N | $108,720 |
Source: Public Records
Tax History Compared to Growth
Tax History
| Year | Tax Paid | Tax Assessment Tax Assessment Total Assessment is a certain percentage of the fair market value that is determined by local assessors to be the total taxable value of land and additions on the property. | Land | Improvement |
|---|---|---|---|---|
| 2025 | $3,473 | $111,760 | $12,400 | $99,360 |
| 2024 | $3,473 | $107,804 | $12,400 | $95,404 |
| 2023 | $3,285 | $96,352 | $12,400 | $83,952 |
| 2022 | $2,753 | $84,183 | $12,400 | $71,783 |
| 2021 | $2,298 | $61,896 | $12,400 | $49,496 |
| 2020 | $2,262 | $61,896 | $12,400 | $49,496 |
| 2019 | $2,398 | $61,896 | $12,400 | $49,496 |
| 2018 | $2,415 | $61,896 | $12,400 | $49,496 |
| 2017 | $2,378 | $61,896 | $12,400 | $49,496 |
| 2016 | $2,380 | $61,896 | $12,400 | $49,496 |
| 2015 | $2,397 | $61,896 | $12,400 | $49,496 |
| 2014 | $2,399 | $61,896 | $12,400 | $49,496 |
Source: Public Records
Map
Nearby Homes
- 1725 Tamarind Way
- 1737 Tamarind Way
- 4015 Goshen Lake Dr S
- 4034 Burning Tree Ln
- 4053 Burning Tree Ln
- 3405 Southern Ridge Ct
- 4036 Goshen Lake Dr S
- 4038 Goshen Lake Dr S
- 4371 E Barcelona Way
- 4383 E Barcelona Way
- 4047 Goshen Lake Dr S
- 4051 Goshen Lake Dr S
- 230 Goshen Rd - Tarragona&valencia Ave
- 4306 E Barcelona Way
- 4304 E Barcelona Way
- 4302 E Barcelona Way
- 4077 Burning Tree Ln
- 2114 Southlake Pkwy
- 230 Goshen Rd - Tarragona&valencia Ln
- 3926 Union Grove Cir
- 1855 Heathers Way
- 1851 Heathers Way
- 1851 Heathers Way
- 1857 Heathers Way
- 1852 Heathers Way
- 1854 Heathers Way
- 1849 Heathers Way
- 1856 Heathers Way
- 1848 Heathers Way
- 1859 Heathers Way
- 1847 Heathers Way
- 1858 Heathers Way
- 1925 Heathers Ct
- 1923 Heathers Ct
- 1844 Heathers Way
- 1861 Heathers Way
- 1845 Heathers Way
- 1860 Heathers Way
- 1921 Heathers Ct
- 1924 Heathers Ct