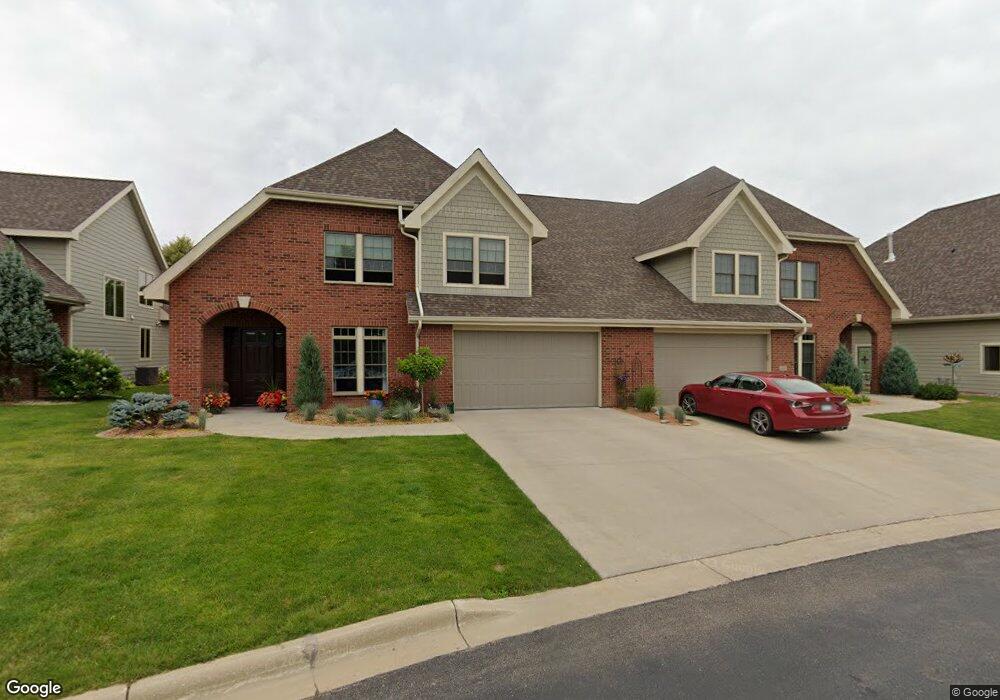
1853 Traders Point Ln SW Rochester, MN 55902
Estimated Value: $566,000 - $609,000
4
Beds
3
Baths
3,213
Sq Ft
$181/Sq Ft
Est. Value
About This Home
This home is located at 1853 Traders Point Ln SW, Rochester, MN 55902 and is currently estimated at $582,815, approximately $181 per square foot. 1853 Traders Point Ln SW is a home located in Olmsted County with nearby schools including Bamber Valley Elementary School, John Adams Middle School, and Mayo Senior High School.
Ownership History
Date
Name
Owned For
Owner Type
Purchase Details
Closed on
Jan 5, 2021
Sold by
Hayward Rachel A and Hayward Mark J
Bought by
Sebo Pamela C
Current Estimated Value
Purchase Details
Closed on
Sep 17, 2018
Sold by
Rieder Mark G and Rieder Coleen R
Bought by
Rieder Mark G and Rieder Coleen R
Purchase Details
Closed on
Feb 14, 2017
Sold by
Hayward Mark J and Hayward Rachel A
Bought by
Hayward Rachel A and Hayward Mark J
Purchase Details
Closed on
Jun 14, 2013
Sold by
Bomgaars Enterprises Inc
Bought by
Penz Rachel
Purchase Details
Closed on
Nov 5, 2009
Sold by
Bomgaars Arnold J and Bomgaars Rebecca A
Bought by
In Bomgaars Enteprises
Home Financials for this Owner
Home Financials are based on the most recent Mortgage that was taken out on this home.
Original Mortgage
$330,000
Interest Rate
4.96%
Mortgage Type
Commercial
Create a Home Valuation Report for This Property
The Home Valuation Report is an in-depth analysis detailing your home's value as well as a comparison with similar homes in the area
Home Values in the Area
Average Home Value in this Area
Purchase History
| Date | Buyer | Sale Price | Title Company |
|---|---|---|---|
| Sebo Pamela C | $475,000 | Rochester Title | |
| Rieder Mark G | -- | None Available | |
| Hayward Rachel A | -- | None Available | |
| Penz Rachel | $343,900 | None Available | |
| In Bomgaars Enteprises | -- | Title Services Inc | |
| Sebo Pamela Pamela | $475,000 | -- |
Source: Public Records
Mortgage History
| Date | Status | Borrower | Loan Amount |
|---|---|---|---|
| Previous Owner | In Bomgaars Enteprises | $330,000 |
Source: Public Records
Tax History Compared to Growth
Tax History
| Year | Tax Paid | Tax Assessment Tax Assessment Total Assessment is a certain percentage of the fair market value that is determined by local assessors to be the total taxable value of land and additions on the property. | Land | Improvement |
|---|---|---|---|---|
| 2024 | $6,900 | $492,900 | $90,000 | $402,900 |
| 2023 | $6,174 | $490,300 | $90,000 | $400,300 |
| 2022 | $6,470 | $487,800 | $90,000 | $397,800 |
| 2021 | $6,300 | $470,400 | $90,000 | $380,400 |
| 2020 | $6,206 | $457,300 | $90,000 | $367,300 |
| 2019 | $6,068 | $432,200 | $80,000 | $352,200 |
| 2018 | $5,151 | $424,700 | $80,000 | $344,700 |
| 2017 | $4,950 | $375,100 | $40,000 | $335,100 |
| 2016 | $4,838 | $338,400 | $39,300 | $299,100 |
| 2015 | $4,548 | $323,200 | $39,100 | $284,100 |
| 2014 | $4,484 | $323,200 | $39,100 | $284,100 |
| 2012 | -- | $110,100 | $40,000 | $70,100 |
Source: Public Records
Map
Nearby Homes
- 1941 Waterford Place SW
- 1568 Salem Ct SW
- 2449 Salem Heights Ln SW
- 3125 Glenwood Rd SW
- 2961 Glenwood Rd SW
- 3177 Glenwood Rd SW
- 1911 Greenfield Ln SW Unit E
- 1814 Mayowood Rd SW
- 1810 Mayowood Rd SW
- 1758 Mayowood Rd SW
- 1750 Mayowood Rd SW
- 1726 Mayowood Rd SW
- 3018 Mayowood Common Cir SW
- 1710 Mayowood Ct SW
- 1702 Mayowood Ct SW
- 2234 Baihly Hills Dr SW
- 1650 Mayowood Ct SW
- 1739 Mayowood Ct SW
- 1658 Mayowood Ct SW
- 1782 Mayowood Ct SW
- 1845 Traders Point Ln SW
- 1861 Traders Point Ln SW
- 1837 Traders Point Ln SW
- 1869 Traders Point Ln SW
- 1821 Traders Point Ln SW
- 1813 Traders Point Ln SW
- 1901 Bamber Valley Rd SW
- 2621 Mayowood Ln SW
- 2615 Mayowood Ln SW
- 2629 Mayowood Ln SW
- 1889 Waterford Place SW
- 1885 Waterford Place SW
- 2609 Mayowood Ln SW
- 1895 Waterford Place SW
- 1879 Waterford Place SW
- 2635 Mayowood Ln SW
- 2456 Crystal Bay Ct SW
- 1899 Waterford Place SW
- 1875 Waterford Place SW
- 1905 Waterford Place SW