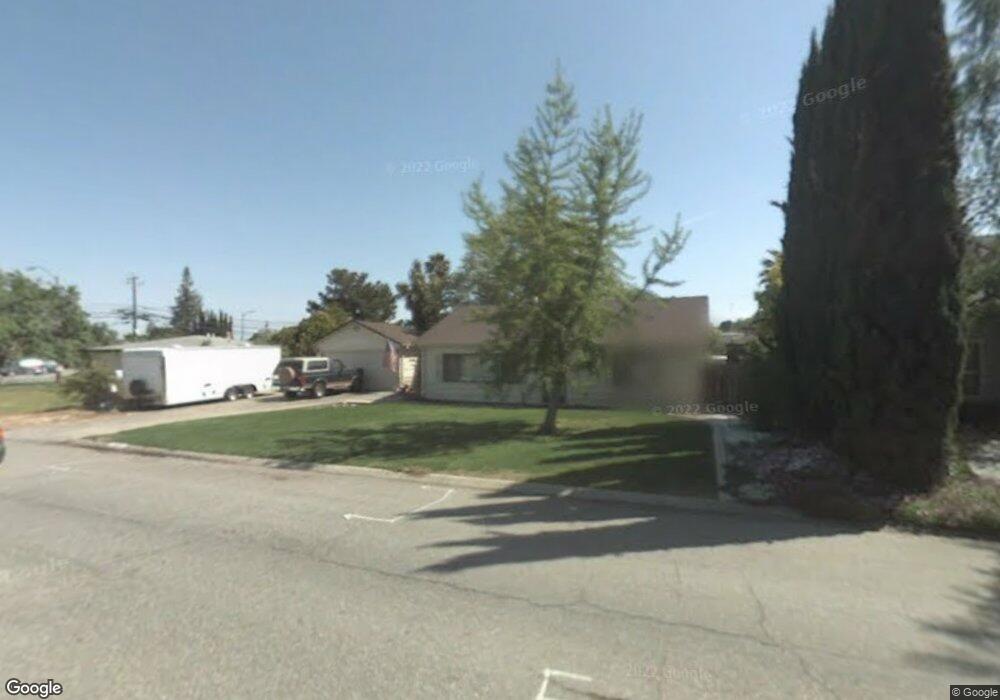
18532 Bucknall Rd Saratoga, CA 95070
Quito Village NeighborhoodEstimated Value: $2,372,913 - $2,497,000
3
Beds
2
Baths
1,260
Sq Ft
$1,920/Sq Ft
Est. Value
About This Home
This home is located at 18532 Bucknall Rd, Saratoga, CA 95070 and is currently estimated at $2,419,478, approximately $1,920 per square foot. 18532 Bucknall Rd is a home located in Santa Clara County with nearby schools including Gussie M. Baker Elementary School, Moreland Middle School, and Prospect High School.
Ownership History
Date
Name
Owned For
Owner Type
Purchase Details
Closed on
May 20, 2004
Sold by
Schwarzenbach Richard James and Schwarzenbach Jacquin Carole
Bought by
Schwarzenbach Ii Richard James and Schwarzenbach Jacquin Carole
Current Estimated Value
Home Financials for this Owner
Home Financials are based on the most recent Mortgage that was taken out on this home.
Original Mortgage
$300,000
Outstanding Balance
$143,324
Interest Rate
5.77%
Mortgage Type
Purchase Money Mortgage
Estimated Equity
$2,276,154
Purchase Details
Closed on
May 13, 2004
Sold by
Force Virgil P
Bought by
Schwarzenbach Ii Richard James and Schwarzenbach Jacquin Carole
Home Financials for this Owner
Home Financials are based on the most recent Mortgage that was taken out on this home.
Original Mortgage
$300,000
Outstanding Balance
$143,324
Interest Rate
5.77%
Mortgage Type
Purchase Money Mortgage
Estimated Equity
$2,276,154
Create a Home Valuation Report for This Property
The Home Valuation Report is an in-depth analysis detailing your home's value as well as a comparison with similar homes in the area
Home Values in the Area
Average Home Value in this Area
Purchase History
| Date | Buyer | Sale Price | Title Company |
|---|---|---|---|
| Schwarzenbach Ii Richard James | -- | Financial Title Company | |
| Schwarzenbach Ii Richard James | $450,000 | Financial Title Company |
Source: Public Records
Mortgage History
| Date | Status | Borrower | Loan Amount |
|---|---|---|---|
| Open | Schwarzenbach Ii Richard James | $300,000 |
Source: Public Records
Tax History Compared to Growth
Tax History
| Year | Tax Paid | Tax Assessment Tax Assessment Total Assessment is a certain percentage of the fair market value that is determined by local assessors to be the total taxable value of land and additions on the property. | Land | Improvement |
|---|---|---|---|---|
| 2025 | $1,789 | $67,623 | $31,850 | $35,773 |
| 2024 | $1,789 | $66,298 | $31,226 | $35,072 |
| 2023 | $1,778 | $64,999 | $30,614 | $34,385 |
| 2022 | $1,769 | $63,725 | $30,014 | $33,711 |
| 2021 | $1,717 | $62,476 | $29,426 | $33,050 |
| 2020 | $1,669 | $61,837 | $29,125 | $32,712 |
| 2019 | $1,608 | $60,625 | $28,554 | $32,071 |
| 2018 | $1,561 | $59,438 | $27,995 | $31,443 |
| 2017 | $1,520 | $58,274 | $27,447 | $30,827 |
| 2016 | $1,382 | $57,132 | $26,909 | $30,223 |
| 2015 | $1,333 | $56,275 | $26,505 | $29,770 |
| 2014 | $1,278 | $55,173 | $25,986 | $29,187 |
Source: Public Records
Map
Nearby Homes
- 12584 Paseo Flores
- 5169 Bobbie Ave
- 2090 Elmgrove Ln
- 1957 Colusa Way
- 11240 Cottonwood Place Unit 38-08 Plan 3
- 11315 Cottonwood Place Unit 39-09 Plan 3
- 11155 Maple Place Unit 34-07 Plan 3
- 11220 Cottonwood Place Unit 36-08 Plan 2
- 11145 Maple Place Unit 33-07 Plan 2
- 10330 Elm Cir Unit 12-03 Plan 2
- 11210 Cottonwood Place Unit 35-08 Plan 4
- 11050 Maple Place Unit 29-06 Plan 3
- 11125 Maple Place Unit 31-07 Plan 2
- 11040 Maple Place Unit 28-06 Plan 2
- 11115 Maple Place Unit 30-07
- Plan 4 at The Elms
- Plan 2 at The Elms
- Plan 3 at The Elms
- 10750 Elm Cir Unit 88-17 Plan 2
- 10740 Elm Cir Unit 87-17 Plan 2
- 18548 Bucknall Rd
- 12721 Quito Rd
- 18533 Paseo Tierra
- 18549 Paseo Tierra
- 12749 Quito Rd
- 18564 Bucknall Rd
- 18533 Bucknall Rd
- 18549 Bucknall Rd
- 18565 Paseo Tierra
- 12669 Quito Rd
- 18565 Bucknall Rd
- 18580 Bucknall Rd
- 18581 Paseo Tierra
- 2106 Quito Rd
- 2116 Quito Rd
- 12655 Quito Rd
- 2094 Quito Rd
- 2128 Quito Rd
- 18532 Paseo Tierra
- 2088 Quito Rd