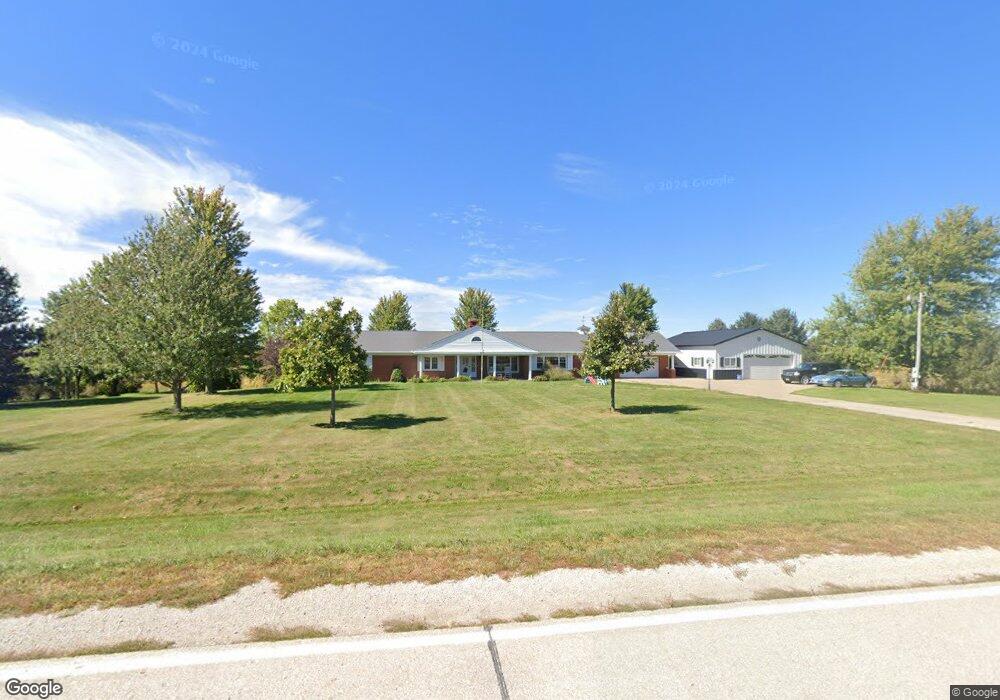
18532 Farson Rd Hedrick, IA 52563
Estimated Value: $297,000 - $585,387
3
Beds
3
Baths
2,798
Sq Ft
$153/Sq Ft
Est. Value
About This Home
This home is located at 18532 Farson Rd, Hedrick, IA 52563 and is currently estimated at $427,796, approximately $152 per square foot. 18532 Farson Rd is a home located in Wapello County with nearby schools including Pekin Elementary School, Pekin Middle School, and Pekin Community High School.
Ownership History
Date
Name
Owned For
Owner Type
Purchase Details
Closed on
Feb 28, 2012
Sold by
Dckaren S The Estate Of Harry R Sterling and Ex Gooden
Bought by
Co Karen Sterling Gooden Trust
Current Estimated Value
Purchase Details
Closed on
Jan 26, 2007
Sold by
Sterling Shane Anthony and Sterling Brooke L
Bought by
Gooden Karen Sterling and Karen Sterling Gooden Trust
Home Financials for this Owner
Home Financials are based on the most recent Mortgage that was taken out on this home.
Original Mortgage
$254,000
Outstanding Balance
$28,244
Interest Rate
6.16%
Mortgage Type
Purchase Money Mortgage
Estimated Equity
$399,552
Create a Home Valuation Report for This Property
The Home Valuation Report is an in-depth analysis detailing your home's value as well as a comparison with similar homes in the area
Home Values in the Area
Average Home Value in this Area
Purchase History
| Date | Buyer | Sale Price | Title Company |
|---|---|---|---|
| Co Karen Sterling Gooden Trust | -- | None Available | |
| Gooden Karen Sterling | $183,000 | None Available |
Source: Public Records
Mortgage History
| Date | Status | Borrower | Loan Amount |
|---|---|---|---|
| Open | Gooden Karen Sterling | $254,000 |
Source: Public Records
Tax History Compared to Growth
Tax History
| Year | Tax Paid | Tax Assessment Tax Assessment Total Assessment is a certain percentage of the fair market value that is determined by local assessors to be the total taxable value of land and additions on the property. | Land | Improvement |
|---|---|---|---|---|
| 2025 | $5,784 | $474,840 | $1,730 | $473,110 |
| 2024 | $5,784 | $445,060 | $1,290 | $443,770 |
| 2023 | $4,856 | $445,060 | $1,290 | $443,770 |
| 2022 | $4,400 | $356,750 | $960 | $355,790 |
| 2021 | $4,402 | $301,940 | $1,010 | $300,930 |
| 2020 | $4,360 | $312,750 | $1,060 | $311,690 |
| 2019 | $4,234 | $297,690 | $0 | $0 |
| 2018 | $4,206 | $297,690 | $0 | $0 |
| 2017 | $4,214 | $294,320 | $0 | $0 |
| 2016 | $3,834 | $288,018 | $0 | $0 |
| 2015 | $3,936 | $288,018 | $0 | $0 |
| 2014 | $3,936 | $288,018 | $0 | $0 |
Source: Public Records
Map
Nearby Homes
- 501 Spring St
- 30951 180th Ave
- 101 N Waugh St
- 0 W 6th St
- 505 W 6th St
- 810 W 6th St
- 0 285th St
- 2048 120th St
- 27776 Highway 149
- 25871 200th Ave
- 405 S 2nd St
- 11994 118th Ave
- 463 E Rochester Rd
- 324 N Harrison St
- 307 E Rochester Rd
- 34 Pinehurst Cir
- 32 Pinehurst Cir
- 0 E Rochester Rd
- 444 Crestview Ave
- 2438 N Jefferson St