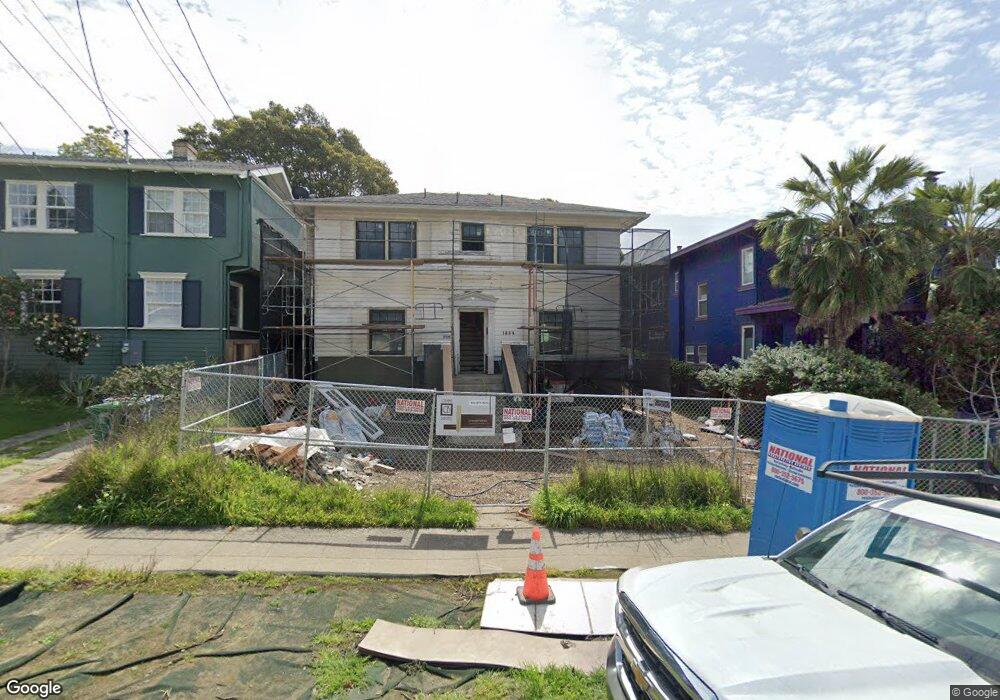
1854 Capistrano Ave Berkeley, CA 94707
Thousand Oaks NeighborhoodEstimated Value: $1,594,246 - $1,821,000
3
Beds
2
Baths
1,432
Sq Ft
$1,172/Sq Ft
Est. Value
About This Home
This home is located at 1854 Capistrano Ave, Berkeley, CA 94707 and is currently estimated at $1,678,562, approximately $1,172 per square foot. 1854 Capistrano Ave is a home located in Alameda County with nearby schools including Thousand Oaks Elementary School, Ruth Acty Elementary, and Berkeley Arts Magnet at Whittier School.
Ownership History
Date
Name
Owned For
Owner Type
Purchase Details
Closed on
Aug 20, 2025
Sold by
Gertonson Lori-Ann and Wagner Todd K
Bought by
Wagner Family Trust and Gertonson
Current Estimated Value
Home Financials for this Owner
Home Financials are based on the most recent Mortgage that was taken out on this home.
Original Mortgage
$1,050,000
Outstanding Balance
$1,044,488
Interest Rate
6.74%
Mortgage Type
New Conventional
Estimated Equity
$634,074
Purchase Details
Closed on
Feb 28, 2024
Sold by
Wagner Todd K and Gertonson Lori-Ann
Bought by
Wagner Family 2013 Trust and Gertonson
Home Financials for this Owner
Home Financials are based on the most recent Mortgage that was taken out on this home.
Original Mortgage
$825,000
Interest Rate
6.63%
Mortgage Type
New Conventional
Purchase Details
Closed on
May 17, 2023
Sold by
Gertonson Lori-Ann
Bought by
Wagner Family 2013 Trust and Gertonson
Purchase Details
Closed on
May 9, 2023
Sold by
Susan Clayworth Trust and Gertonson Lori-Ann
Bought by
Gertonson Lori-Ann
Purchase Details
Closed on
Jan 17, 2023
Sold by
Clayworth Susan
Bought by
Gertonson Lori-Ann and Gertonson Lori-Ann
Create a Home Valuation Report for This Property
The Home Valuation Report is an in-depth analysis detailing your home's value as well as a comparison with similar homes in the area
Home Values in the Area
Average Home Value in this Area
Purchase History
| Date | Buyer | Sale Price | Title Company |
|---|---|---|---|
| Wagner Family Trust | -- | Old Republic Title Company | |
| Gertonson Lori-Ann | -- | Old Republic Title Company | |
| Wagner Family 2013 Trust | -- | None Listed On Document | |
| Wagner Todd K | -- | Old Republic Title Company | |
| Wagner Family 2013 Trust | -- | None Listed On Document | |
| Gertonson Lori-Ann | -- | None Listed On Document | |
| Gertonson Lori-Ann | -- | None Listed On Document |
Source: Public Records
Mortgage History
| Date | Status | Borrower | Loan Amount |
|---|---|---|---|
| Open | Gertonson Lori-Ann | $1,050,000 | |
| Previous Owner | Wagner Todd K | $825,000 |
Source: Public Records
Tax History
| Year | Tax Paid | Tax Assessment Tax Assessment Total Assessment is a certain percentage of the fair market value that is determined by local assessors to be the total taxable value of land and additions on the property. | Land | Improvement |
|---|---|---|---|---|
| 2025 | $19,102 | $1,300,500 | $468,180 | $832,320 |
| 2024 | $19,102 | $1,275,000 | $459,000 | $816,000 |
| 2023 | $4,573 | $81,371 | $56,558 | $31,813 |
| 2022 | $4,362 | $79,639 | $55,449 | $31,190 |
| 2021 | $4,325 | $77,940 | $54,362 | $30,578 |
| 2020 | $3,962 | $84,069 | $53,804 | $30,265 |
| 2019 | $3,650 | $82,421 | $52,750 | $29,671 |
| 2018 | $3,537 | $80,805 | $51,715 | $29,090 |
| 2017 | $3,380 | $79,220 | $50,701 | $28,519 |
| 2016 | $3,149 | $77,667 | $49,707 | $27,960 |
| 2015 | $3,080 | $76,501 | $48,961 | $27,540 |
| 2014 | $3,003 | $75,003 | $48,002 | $27,001 |
Source: Public Records
Map
Nearby Homes
- 1983 Yosemite Rd
- 753 Peralta Ave
- 765 San Diego Rd
- 813 San Diego Rd
- 770 Santa Barbara Rd
- 826 Indian Rock Ave
- 731 Santa fe Ave
- 589 San Luis Rd
- 758 Spruce St
- 415 Berkeley Park Blvd
- 1950 Hopkins St
- 483 Boynton Ave
- 1498 Sonoma Ave
- 777 Cragmont Ave
- 614 Cragmont Ave
- 380 Vermont Ave
- 118 Ramona Ave
- 1004 Cragmont Ave
- 470 Spruce St
- 1036 Ramona Ave
- 1850 Capistrano Ave
- 1860 Capistrano Ave
- 1864 Capistrano Ave
- 1855 Tacoma Ave
- 1846 Capistrano Ave
- 1849 Tacoma Ave
- 1859 Tacoma Ave
- 1863 Tacoma Ave
- 1843 Tacoma Ave
- 1870 Capistrano Ave
- 1840 Capistrano Ave
- 1855 Capistrano Ave
- 1861 Capistrano Ave
- 1851 Capistrano Ave
- 1865 Capistrano Ave
- 1869 Tacoma Ave
- 1839 Tacoma Ave
- 1845 Capistrano Ave
- 1874 Capistrano Ave
- 1869 Capistrano Ave
Your Personal Tour Guide
Ask me questions while you tour the home.